scOrange Workflows
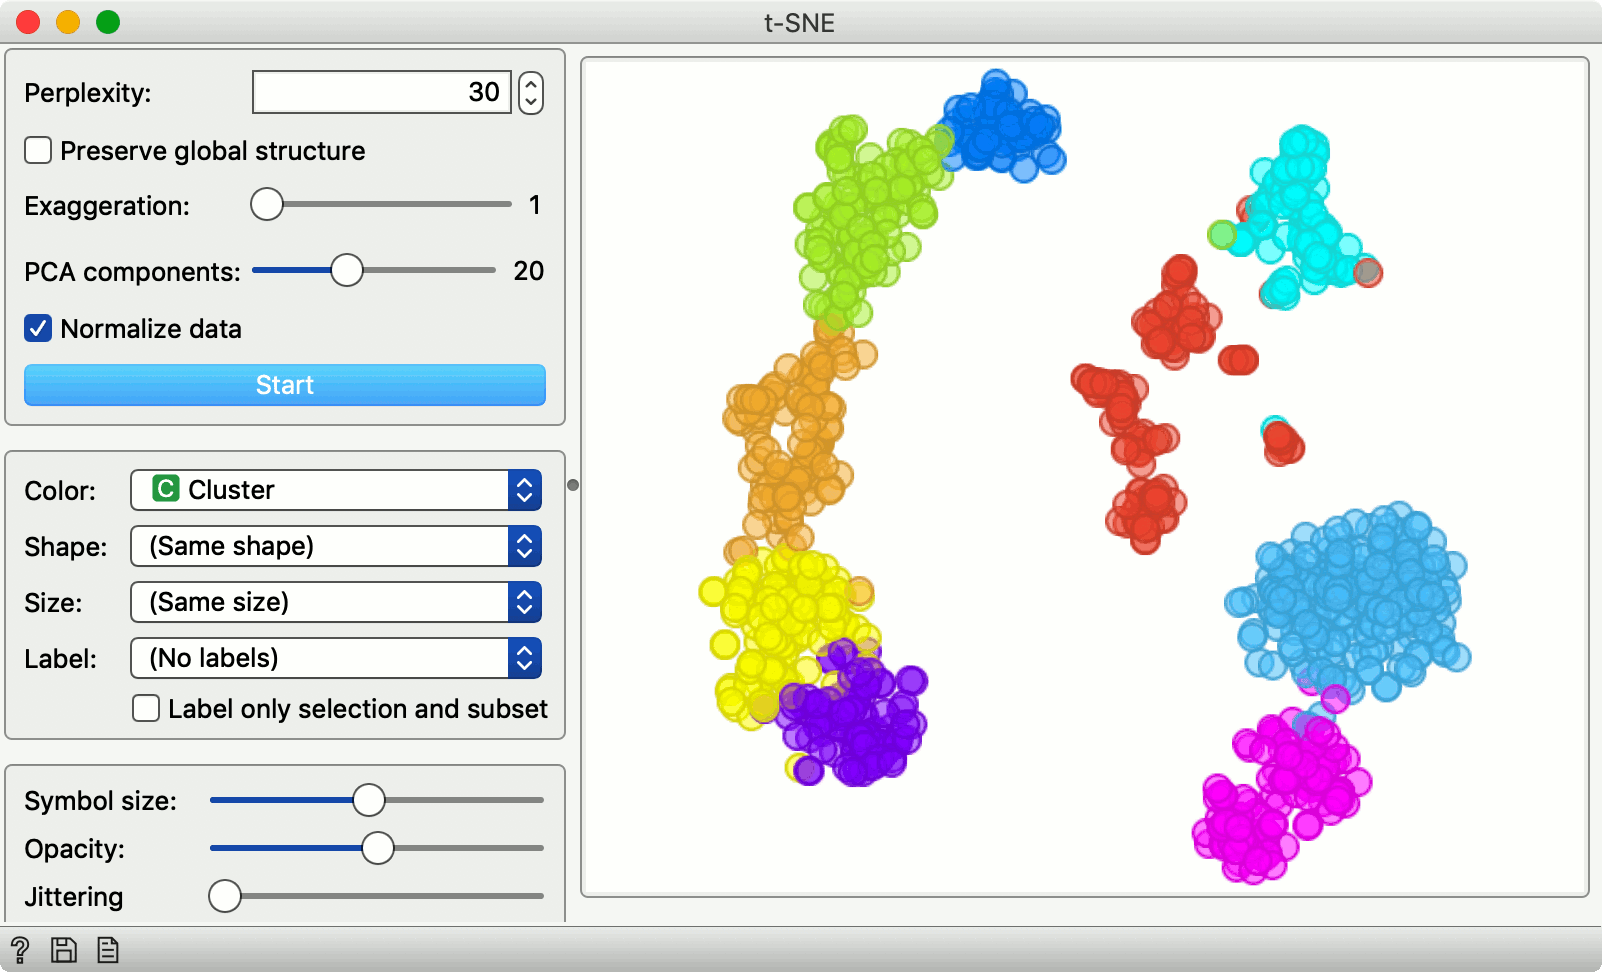
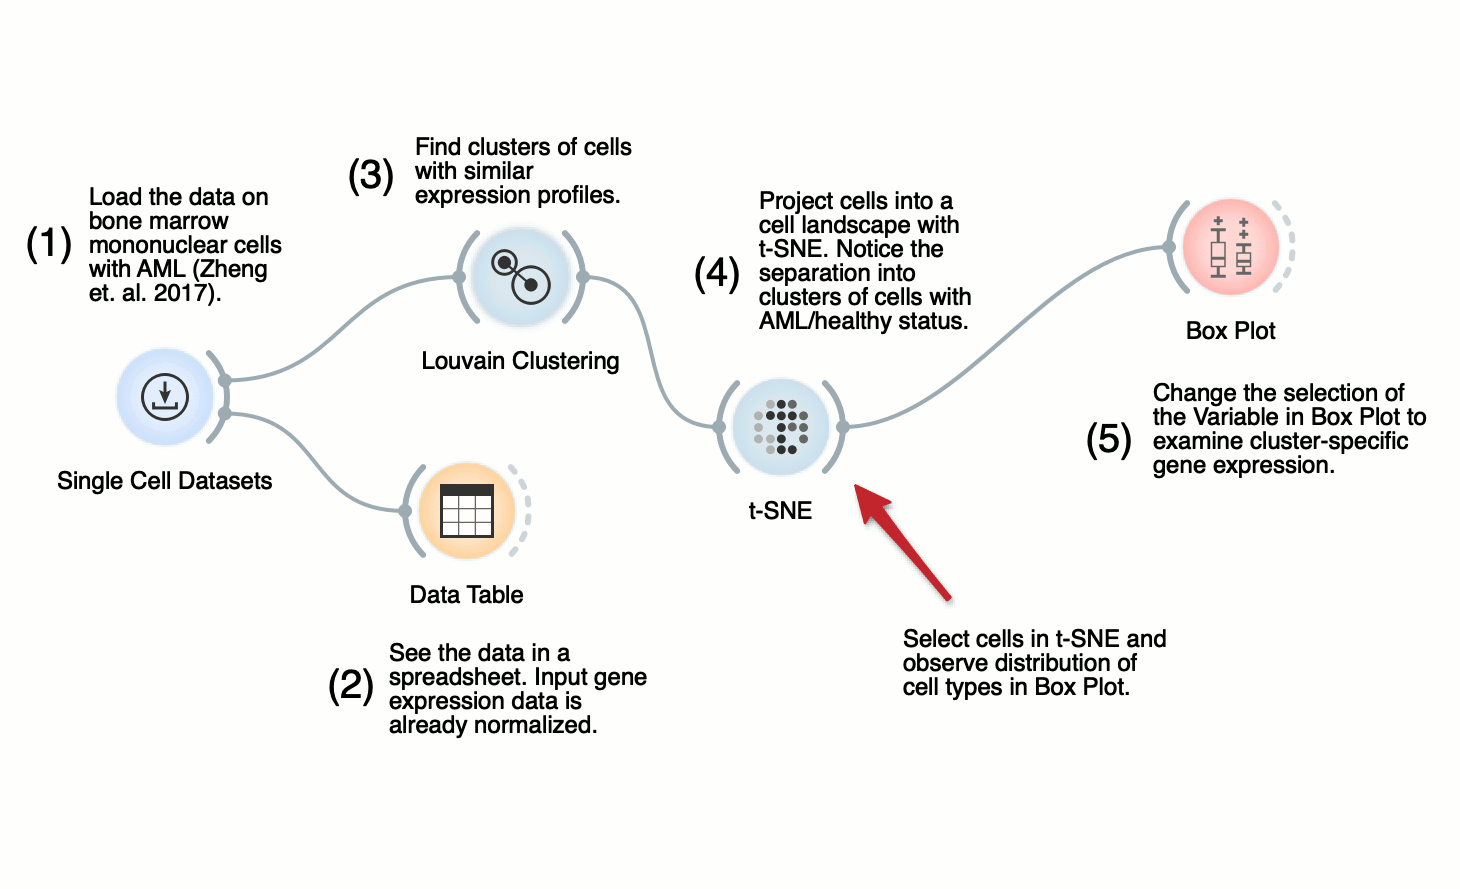
Clustering and t-SNE
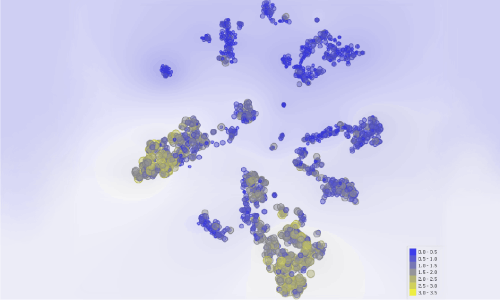
Load the data, cluster, and explore the clustering structure in the t-SNE embedding. Select a subset of cells in the embedding to examine their type in the Box Plot.
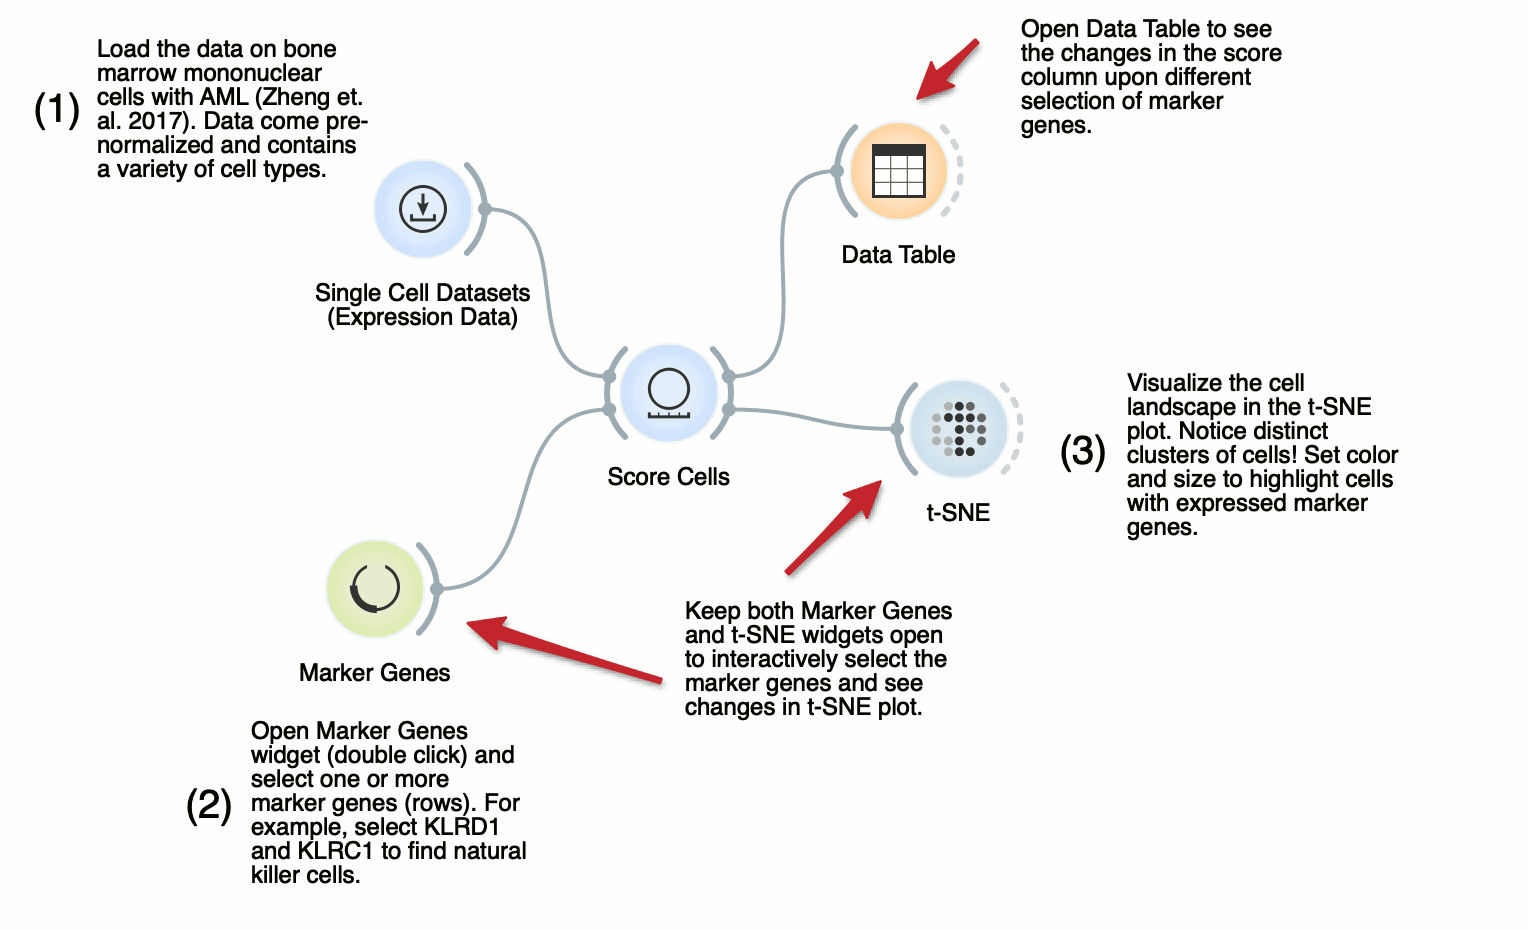
Marker Genes and Subpopulations
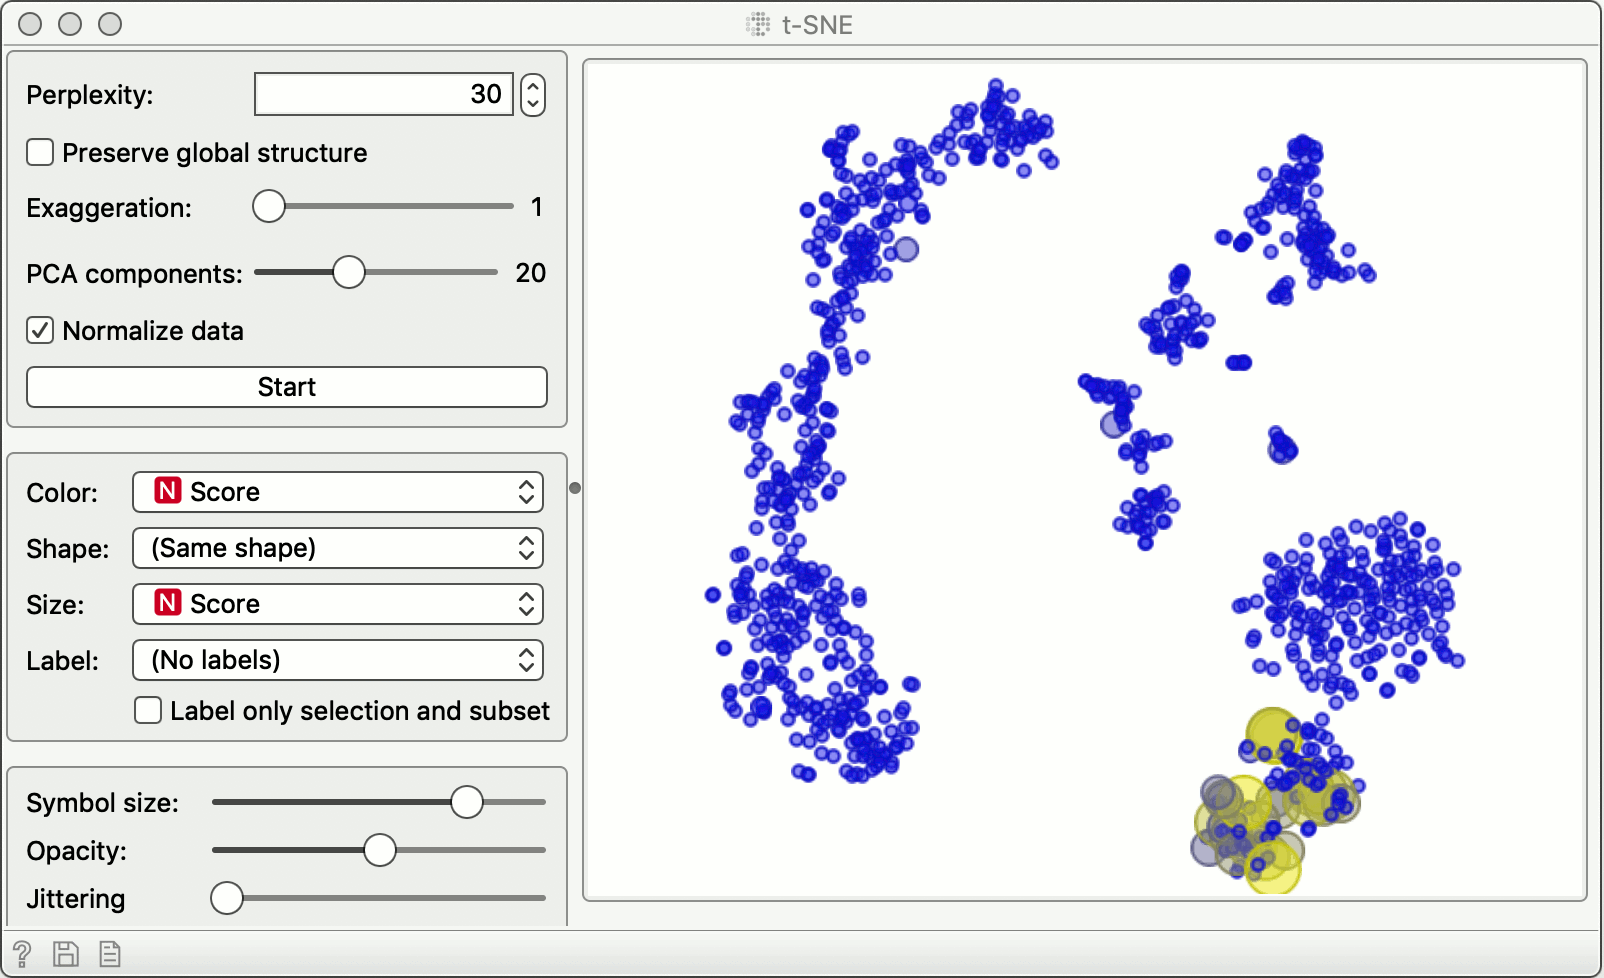
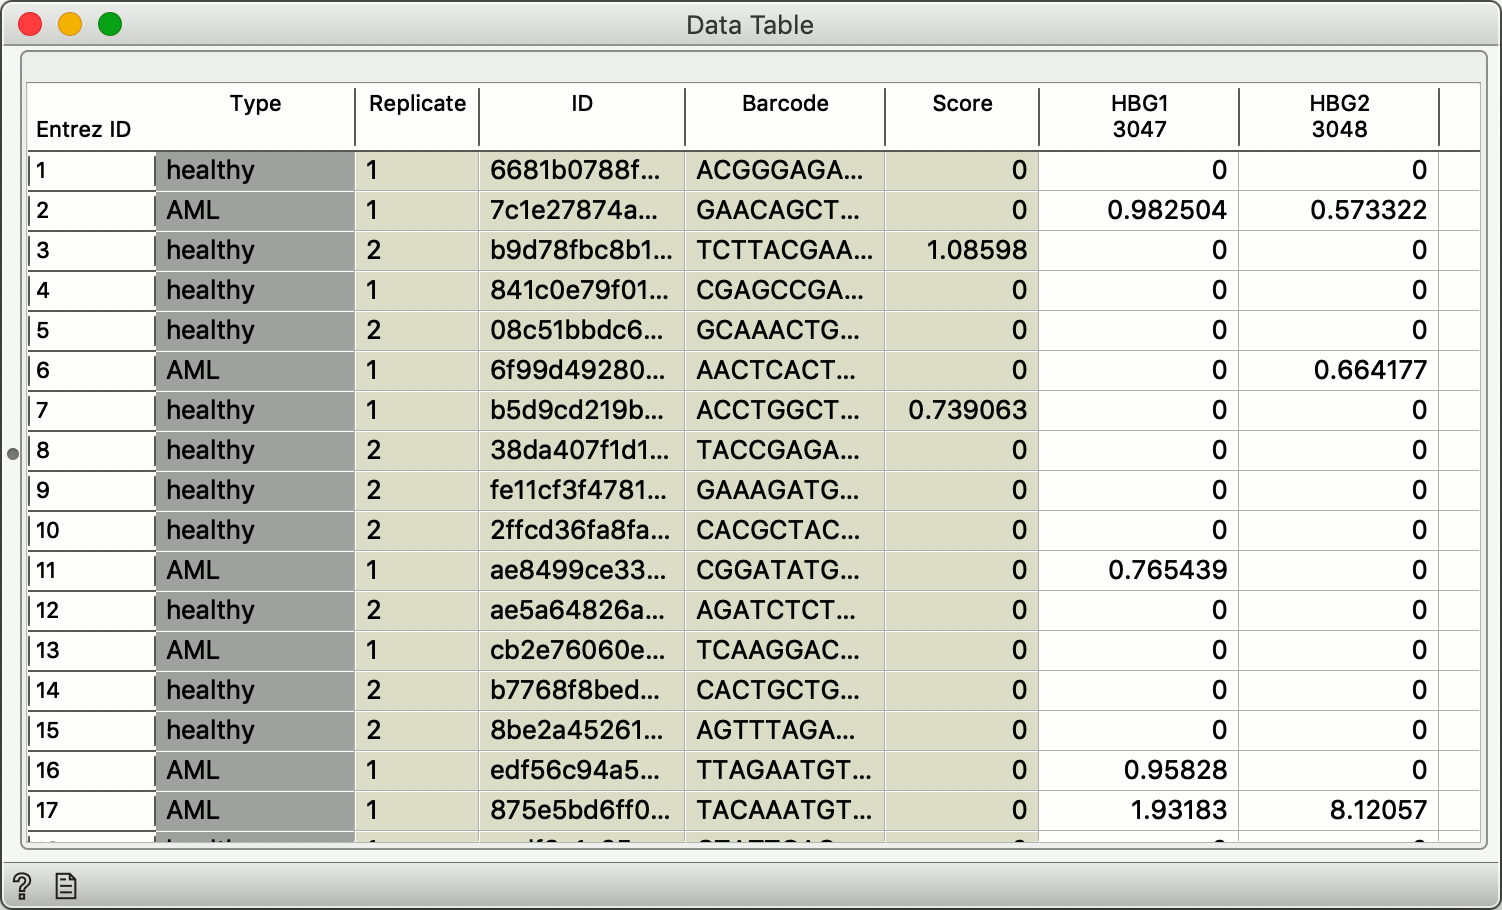
This workflow uses the Score Cell and the Marker Genes widget to score the cells according to the expression of selected markers. Scored cells can be passed to, say, t-SNE visualization, where any change of a selection of marker genes will automatically trigger the update in t-SNE to identify an associated subpopulation of cells.
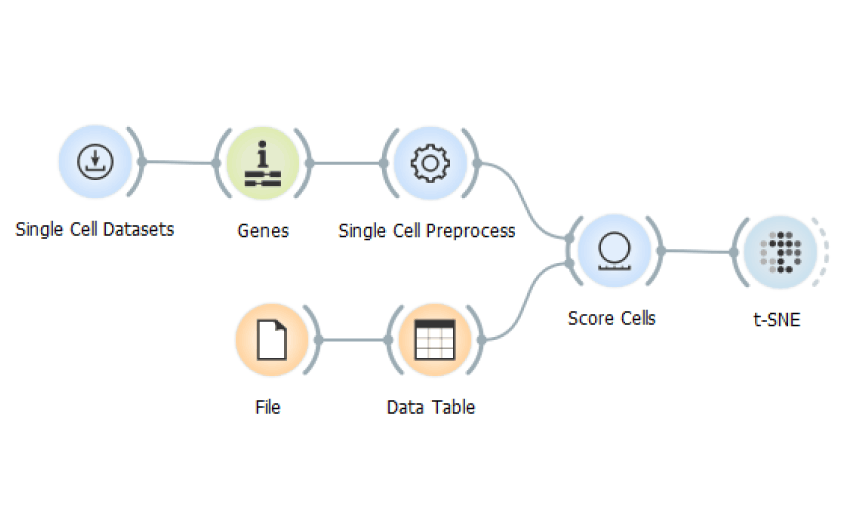
Importing and Using Your Own Marker Genes
Enables you the importation of your own marker genes in the .tab format.
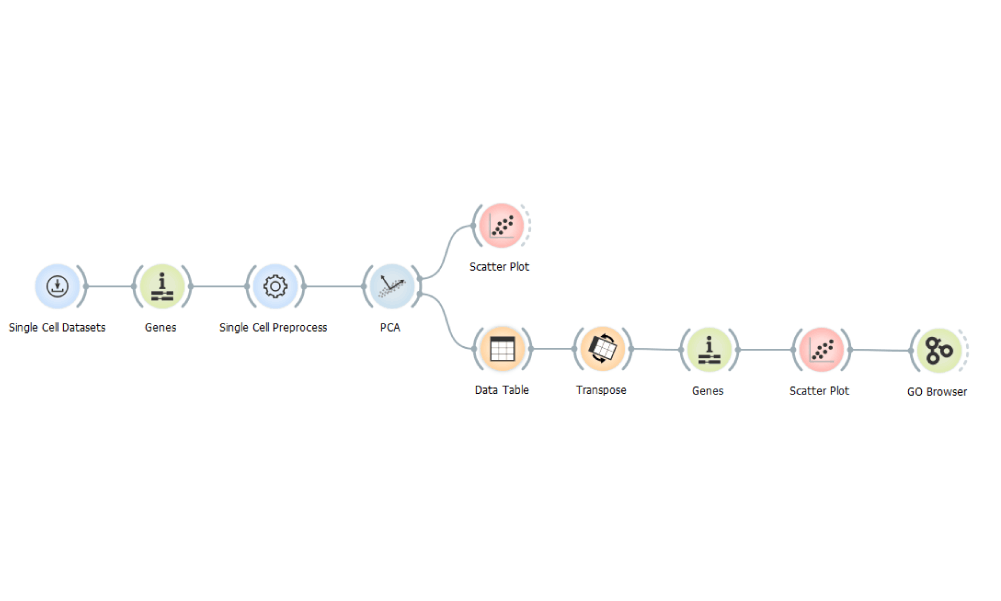
Profiling Human Osteoarthritis Cartilage Chondrocytes
Identify the genes affiliated with osteoarthritis progression in the articular cartilage samples.