scOrange Workflows
Data Visualization with t-SNE
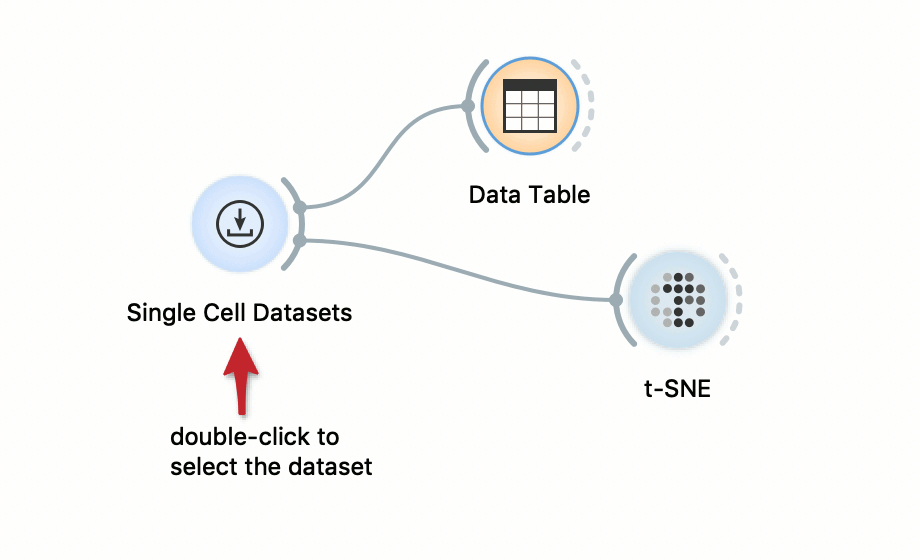
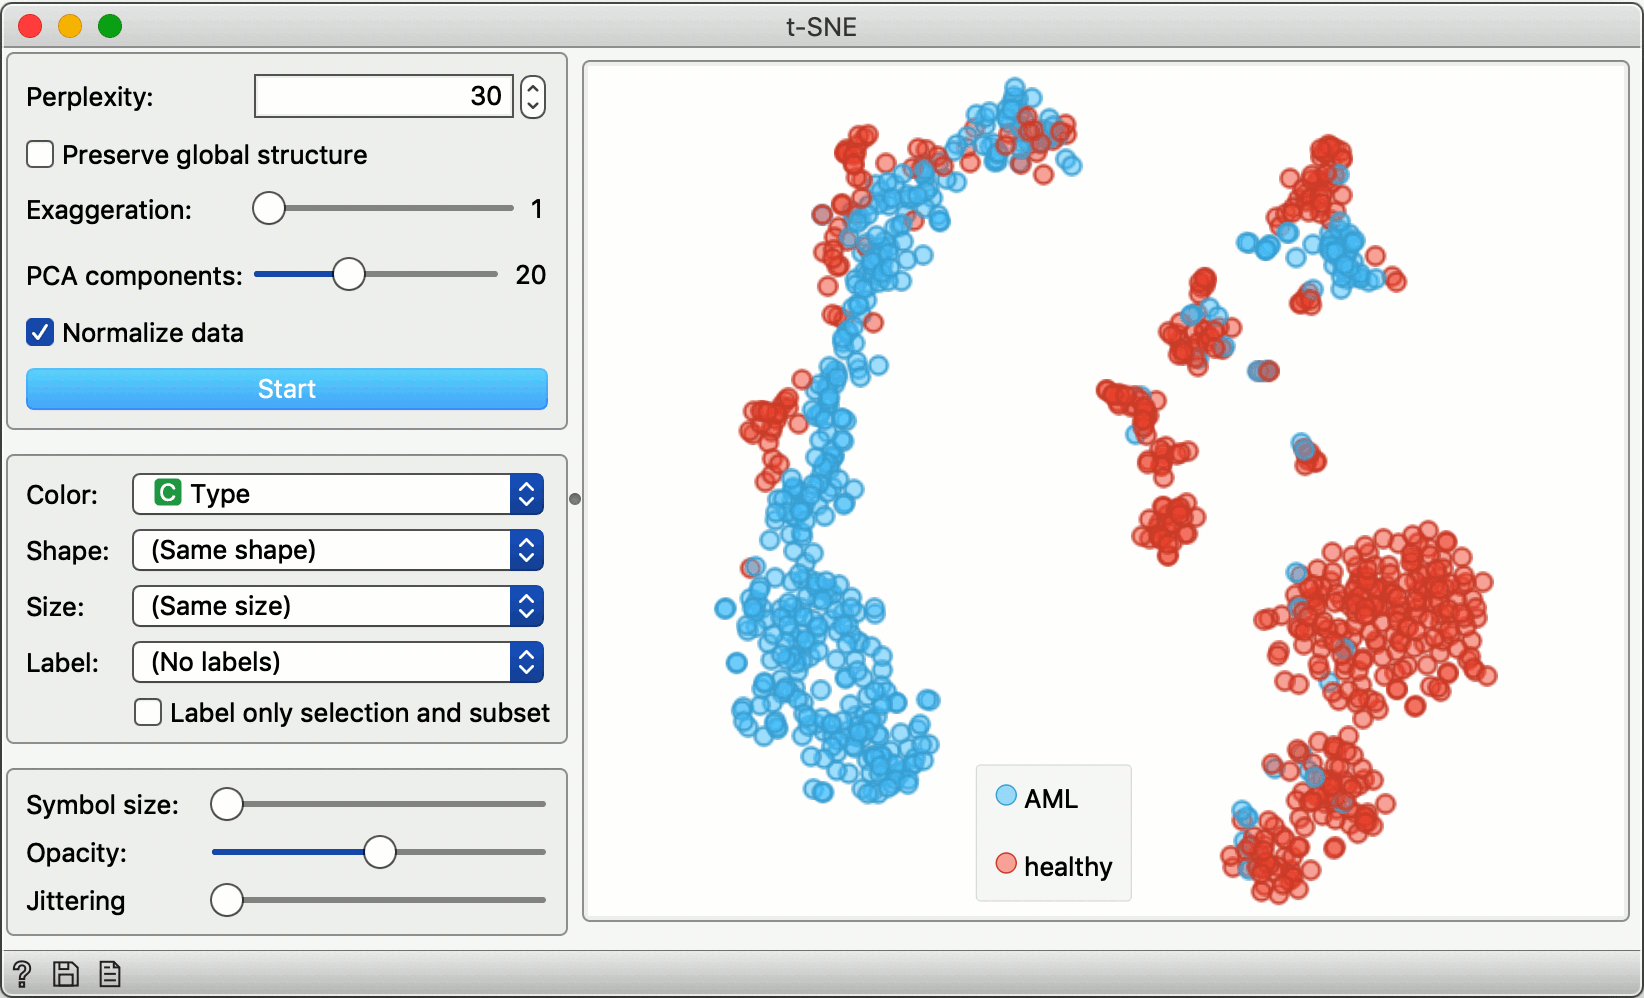
Loads the data from scOrange’s single-cell datasets server and feeds it into a spreadsheet viewer and a t-SNE visualization. To see the raw data, double click on the Data Table widget. Double click on the t-SNE widget to display the cell landscape.
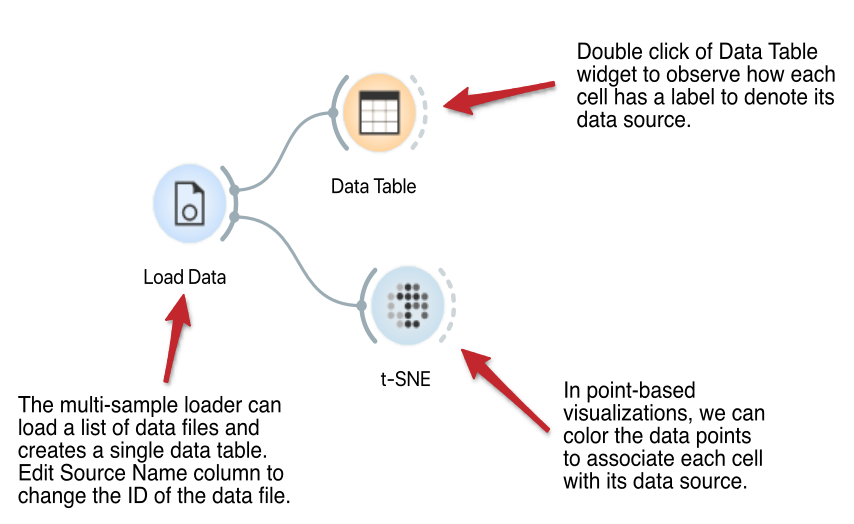
Multi-Sample Loader
The Load Data widget reads the data from the tab or comma delimited text files or annotated 10x Genomics data files. Drag-and-drop to create a list of files to load. Use cell or gene sampling, if required. The loader creates a single data set and marks the cells according to the data source.
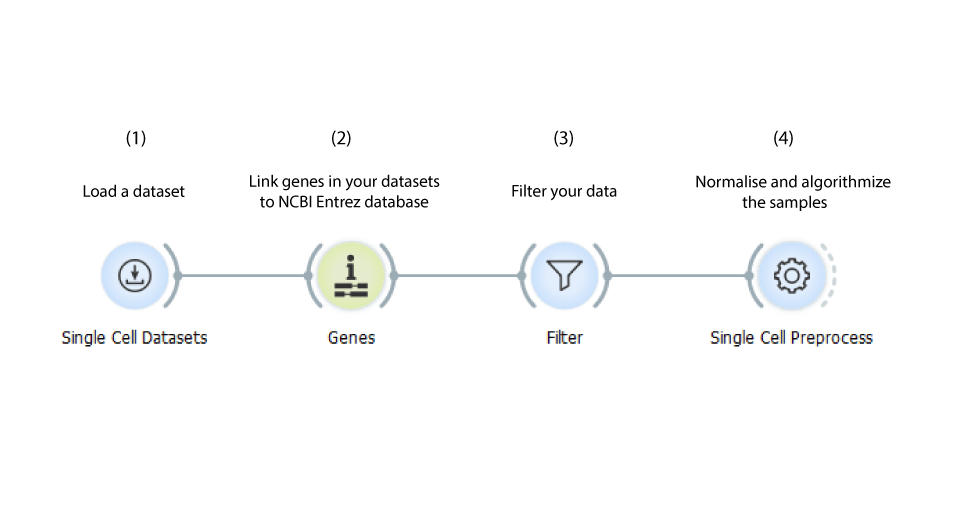
General Preprocessing
Loads the data, annotates it and filters it. The Single Cell Preprocesses widget normalises and log-transforms the samples, additionally it can be used to select the most variable genes or to standardize them. Such data can be further analysed.
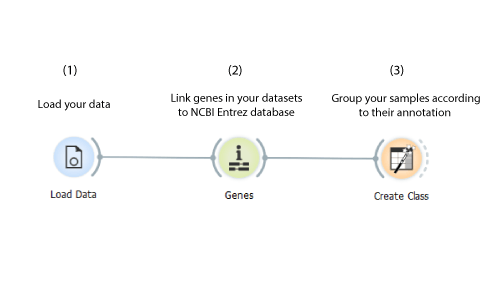
Annotating Data
Load your data with the Load Data widget, feed it to the Genes widget to recognise and annotate the genes in your dataset employing the NCBI Entrez database. Create a new class attribute and group the samples according to their annotation using the Create Class widget.