Note: This blog heavily references and uses the data we identified in our previous blog Clustering Cells in Mouse Pancreas, therefore it is advisable for everyone less experienced with scOrange to read it before tackling this one.
Orange already has a build-in widget with marker genes, but what if your marker genes are not included in its library? Well, there is no reason to give up, with only a few extra steps you can easily import your own.
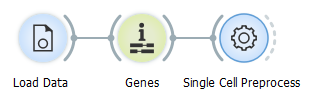
As usual, we first need to import our data. We are using the data from mouse pancreas (Baron et al., GEO accession: GSE84133). We import and normalise our data using Load Data, Gene Name Matcher and Single Cell Preprocess widgets (a detailed description of these steps is available in our previous blog Clustering Cells in Mouse Pancreas). Alternatively, you can avoid downloading the data from the GEO database by using the Single Cell Datasets widget to load the dataset Pancreas cells in mouse.

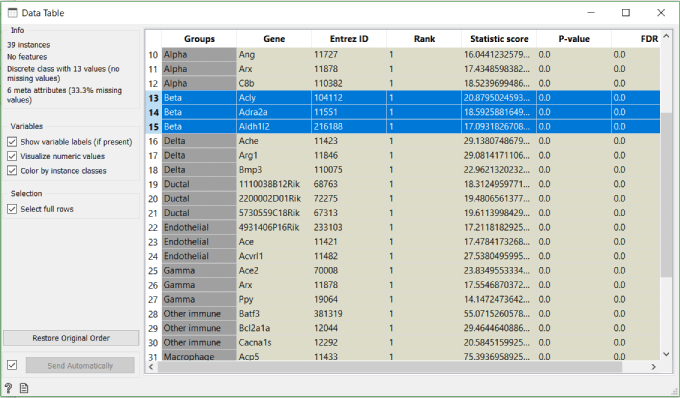
We can import our marker genes using the File widget. Here we are using the marker genes that we identified and saved in the last steps of our earlier blog. Marker genes can be formatted in a simple table. In case your data does not include Entrez IDs for your genes, you have to process them with the Genes widget first (with organism set to Mus Musculus in this case), so that scOrange assigns them Entrez IDs and can later match them to the genes in the data you are analysing.
To connect out marker genes and our data, we use Score Cells widget and make sure we correctly mark our input data. Marker genes should be attached as genes and our data as data.
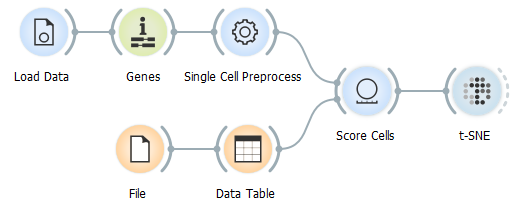
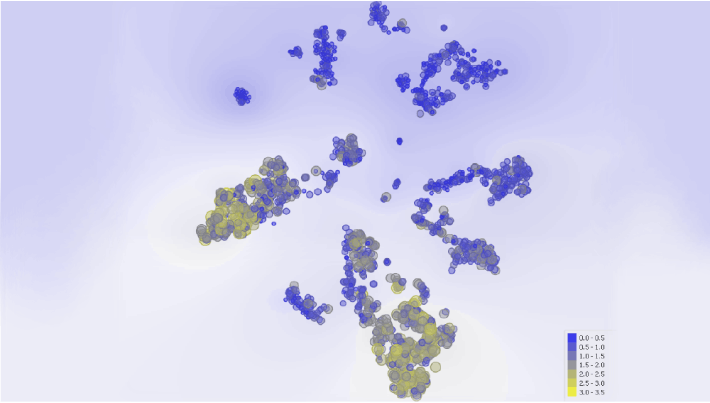
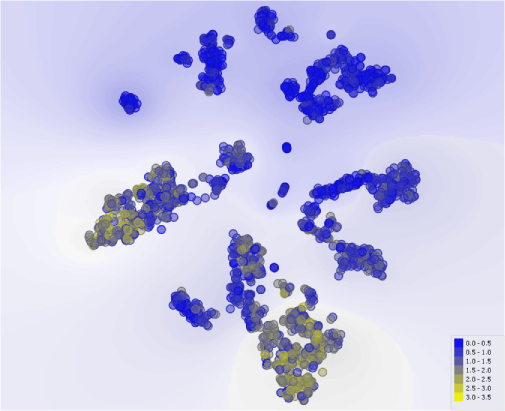
Orange has now scored cells based on our markers. To visualise this, we use t-SNE and colour cells based on the Cell Score with it. Since yellow coloured cells in this graph represent cells that score higher for selected genes and we selected the markers for beta cells in in the previous step, these are more likely to be beta cells.
References
Baron M., Veres A., Wolock S..L, et al. A Single-Cell Transcriptomic Map of the Human and Mouse Pancreas Reveals Inter- and Intra-cell Population Structure. Cell Syst. 2016;3(4):346–360.e4. doi:10.1016/j.cels.2016.08.011