
Osteoarthritis is one of the most common and costly chronic conditions. A better understanding of the genetical background and the expression changes during osteoarthritis progression could help with the diagnosis and the predictions of treatment outcomes. Therefore, in this short blog, we will take a look at the genes affiliated with osteoarthritis progression.

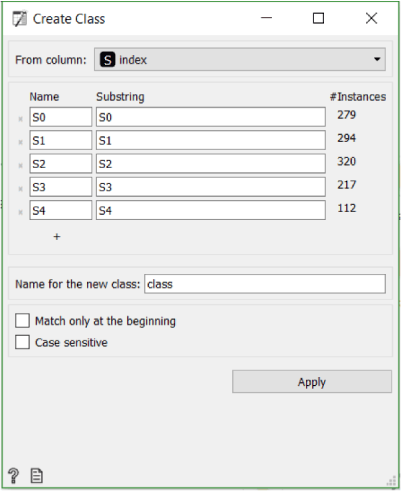
The processing of the data downloaded from the GEO database (accession number: GSE104782) will be a bit longer than usual this time. We start by eliminating the batch effect, since we don’t want the differences between the 32 individuals sampled in this study to interfere with our analysis of gene expression. Alternatively, you can skip the batch effect removal by downloading the Human osteoarthritis chondrocytes dataset with the Single Cell Datasets widget. After that we use the Genes widget to match gene names in the data to their IDs and the Create Class widget to mark cells based on the stage of osteoarthritis as microscopically diagnosed by Ji et al. (S0 = normal articular cartilage, S4=exposed subchondral bone).
Continuing with the Single Cell Preprocess widget, we select the 500 most variable genes, logarithmize and normalise the data. In the PCA widget we select 4 components, that together cover 37% of the variance.

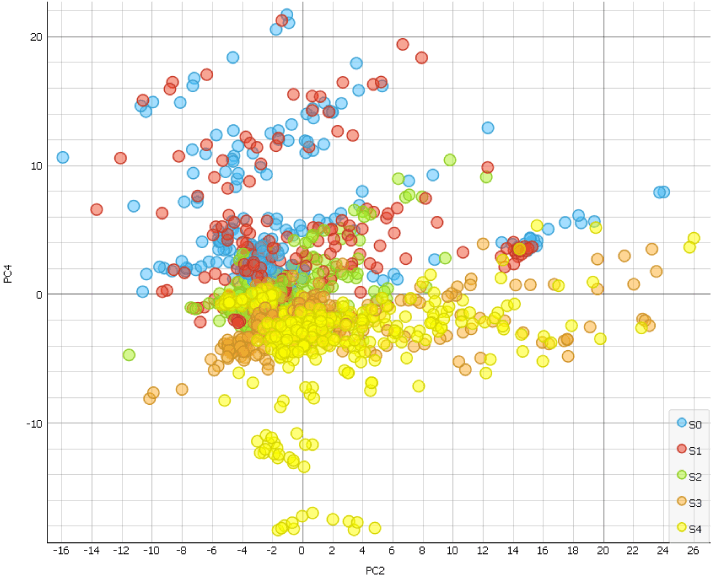
The scatter Plot widget helps us identify the PC4 as the principal component with the strongest disease-stage progression.
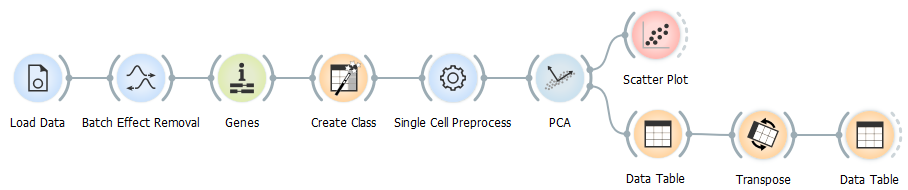
This means we can now use PC4 scoring to determine genes associated with osteoarthritis progression. Export components from the PCA widget to the Data Table widget. If you open the table, you will notice that genes are displayed in rows and principal components in columns. If we want to organise genes by ascending or descending PC4 score, we need the principal components in rows. We can simply achieve this by using the Transpose widget. Now we can order genes by the PC4 scores by clicking the PC4 column.
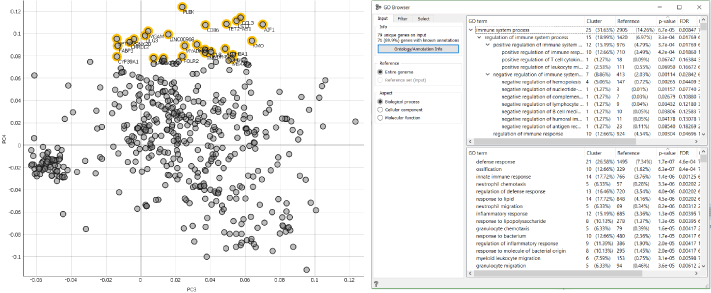
We can now take a look at the genes with negative correlation for PC4 (PTGES, NPR3, ANGPTL1, POSTN) and those with positive correlation (IL1B, CHRDL2, CCl3, CXCL3) and determine their biological role using the GO Browser widget.
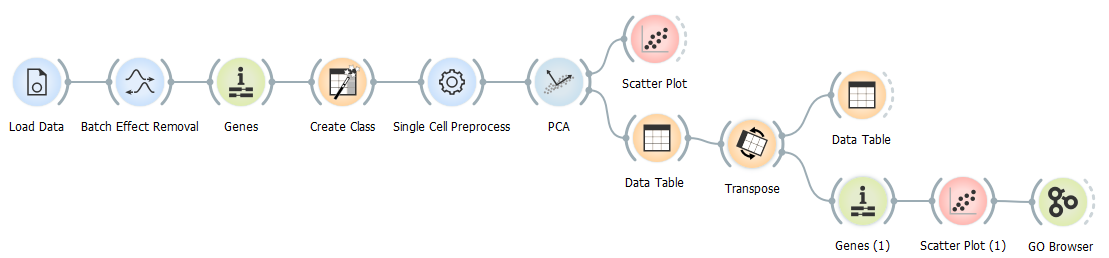
Since the PCA widget overruns the gene annotations in our data, we have to run it trough the Genes widget again, then display it with the Scatter Plot widget, manual select positively or negatively corelated genes on the plot and use it as an input for the GO Browser.
Genes with positive correlation for PC4, as displayed on the image below, are mainly involved in skeletal system development (ossification) and cellular responses to stress (defense response, innate immune response) suggesting the early changes that occur during the osteoarthritis pathogenesis and those with negative correlation for PC4 are mainly involved in extracellular matrix organisation (tissue development, animal organ morphogenesis) and collagen metabolism (skeletal system development, odontogenesis). This makes sense since metabolic pathways switch towards glycolysis during osteoarthritis progression and in doing so contribute to impaired extracellular matrix synthesis and anabolic processes.
Now you see just how quick and easy identifying, annotating and explaining the genes affiliated with a certain trait (osteoarthritis progression) is in scOrange.
References
Ji Q, Zheng Y, Zhang G, et al. (2019) Single-cell RNA-seq Analysis Reveals the Progression of Human Osteoarthritis. Annals of the Rheumatic Diseases, 78(1), 100–110.