
Note: This blog deals with the same topic as our blog Embedding New Cells onto an Existing t-SNE Projection, but uses a new widget the Annotator in doing so, therefore it is advisable to run through it first and get some background from it.
In our previous blog we looked at the new Annotator widget and how it can be used to effortlessly group and identify cell types in your dataset. Here we will explore another feature of the same widget: the embedding of the new cells onto an existing tSNE projection.
We will be using the data gathered by Galen et al. (Cell, 2019) which is available in our datasets, so you do not have to be concerned with downloading and importing it.
Essentially, we will go through the same process as in blog Embedding New Cells onto an Existing t-SNE Projection, but thanks to the new widget it will take us considerably less effort and time.
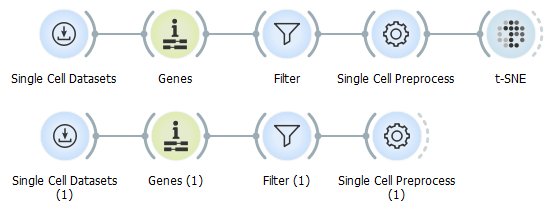
Firstly, we need to load our datasets and pre-process them. We will be using the Healthy human bone marrow as our primary and the AML patient bone marrow day 0 as our secondary dataset. Find the mentioned datasets in two separate Single Cell Datasets widgets, annotate the genes with the Genes widget, filter them and use the Single Cell Preprocess widget to normalise the samples on counts per million and put them on a logarithmic scale. Make a t-SNE projection from the Healthy human bone marrow dataset.
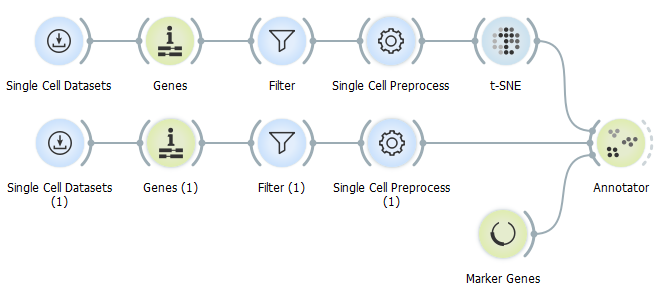
Use the t-SNE as reference data input to the Annotator widget and AML patient dataset as the secondary data input.
Since this projection would be much easier to analyse if it also displayed cell types, we add the Marker Genes widget to our workflow to annotate the cell groups.
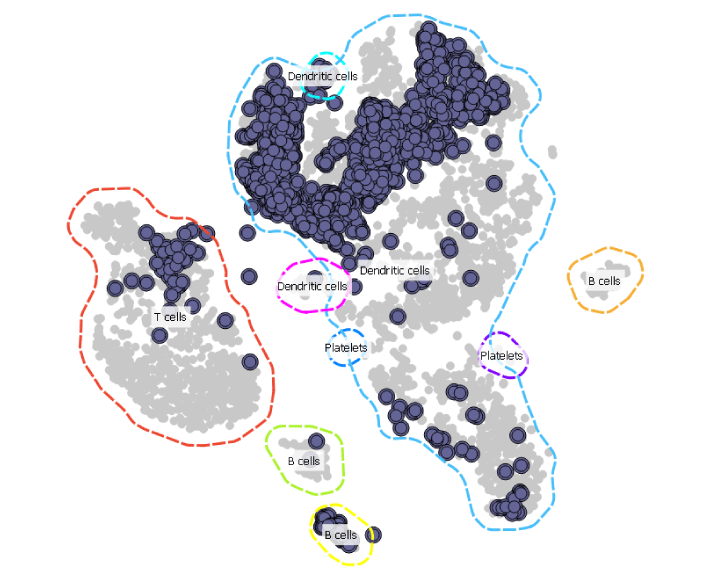
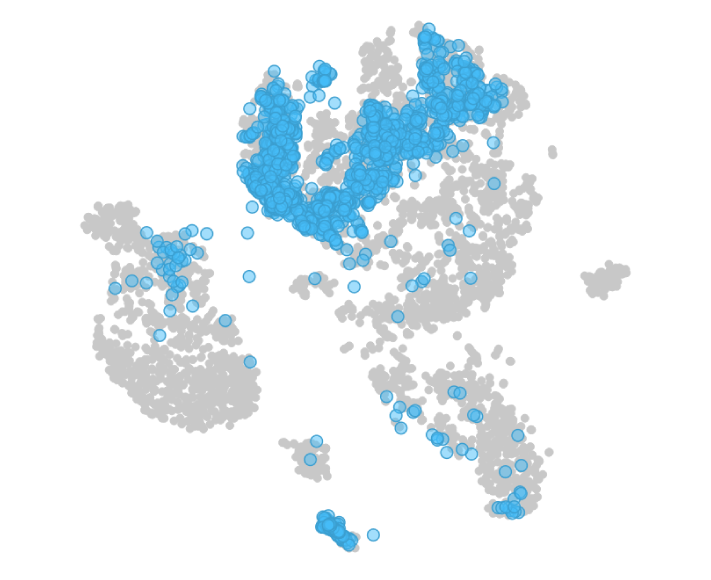
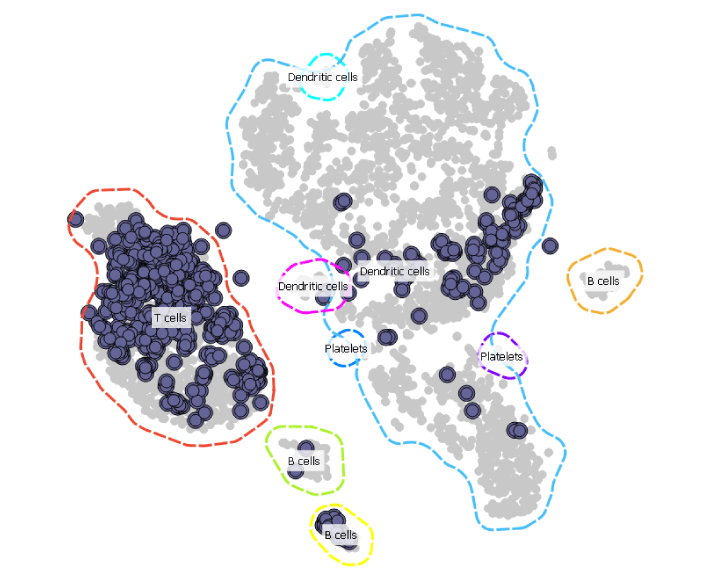
Now this is much easier to interpret. The sample from the AML patient seems to contain most of the cell types present in a healthy donor.
There are two more datasets significant for this case in our database that we can explore. One of the AML patient right after undergoing therapy and other of the same patient recovering from the treatment. Let us take a look at how they match up to the healthy sample by simply changing our datasets in the Single Cell Datasets widget that leads up to the Annotator widget as secondary data input.
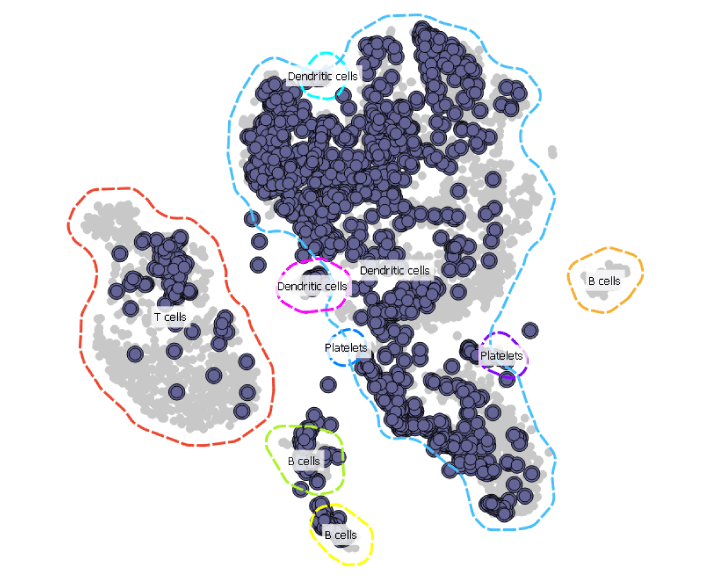
The effect of chemotherapy in the sample AML patient bone marrow day 15 is well noticeable. Cell clearance has taken place and the cells here are predominantly T cells.
Sample taken on the 31st day shows that the patient has recovered and the hematopoietic stem cells have repopulated.
As we can see, comparing to the effort in our blog Embedding New Cells onto an Existing t-SNE Projection, the Annotator widget really does simplify the embedding of the new cells onto and an existing tSNE projection.
References:
Van Galen P, Hovestadt V, Wadsworth MH, et al. (2016). Single-Cell RNA-Seq Reveals AML Hierarchies Relevant to Disease Progression and Immunity. Cell, 176(6), 1265–1281.