Note: This blog deals with the same topic as our previous blog Clustering Cells in Mouse Pancreas , but uses a new widget the Annotator in doing so, therefore it is advisable to run through it first and get some background from it.
We have some great news for you: do you still remember how many steps we took in (Clustering Cells in Mouse Pancreas blog to identify and group cell types? Well, the whole process just got much simpler with our new widget: the Annotator.
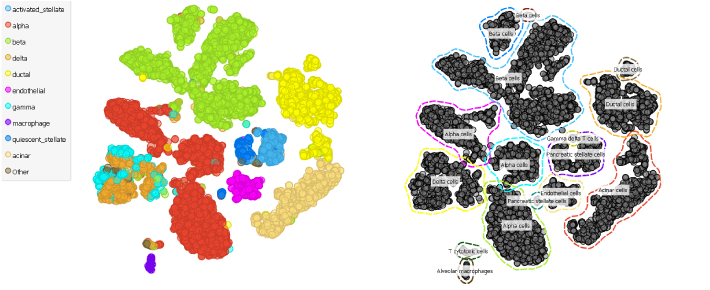
Again, we will be looking at the single cell data from the pancreas (Baron et al., 2017, GEO accession: GSE84133), but this time we will be using the data from human donors.
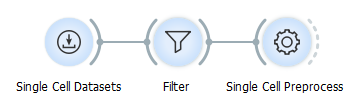
You have two options here: download the data from the GEO database and import it into scOrange using the Load Data widget and annotate it with the Genes widget or simply find it in the Single Cell Datasets widget.
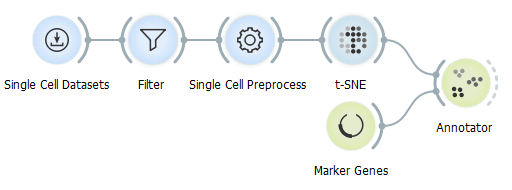
Use the t-SNE widget for visualisation purposes and then drive all the data to the Annotator widget as reference data input. With the Marker Genes we can omit the trouble of finding the proper genes, just do not forget to select Human as your organism and fell free to select either of the databases currently available in the widget.
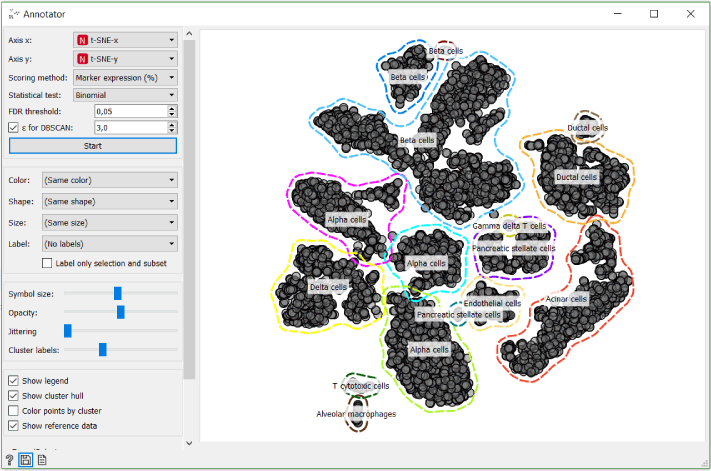
In the Annotator widget select t-SNE-x and t-SNE-y as your axises, score cells based on marker expression and set Ɛ for DBSCAN to 3.
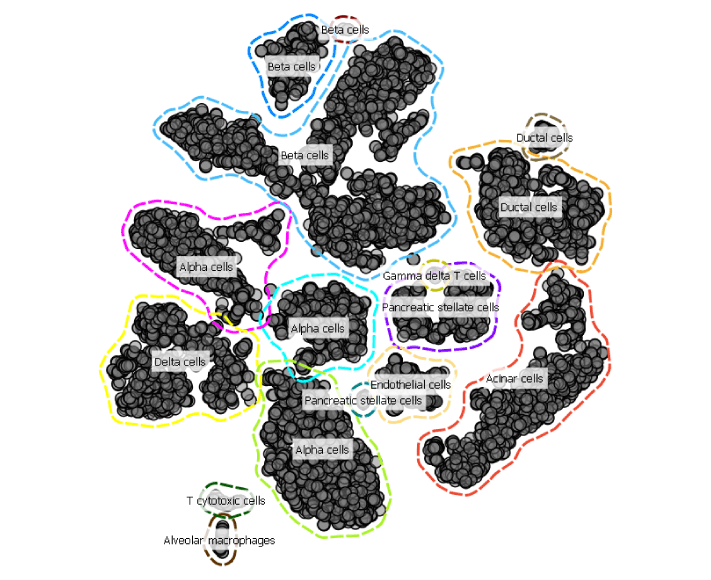
See, it is that simple to annotate cell types. Now you are able to move towards analysing each cell type much faster.
References
Baron M., Veres A., Wolock S.L., et al. A Single-Cell Transcriptomic Map of the Human and Mouse Pancreas Reveals Inter- and Intra-cell Population Structure. Cell Syst. 2016;3(4):346–360.e4.