Single cell data can be used to identify and separate individual cell types in bulk samples. In this blog we will take a look at pancreatic cells from two mouse strains (Baron et al., 2017, GEO accession: GSE84133), cluster them according to their cell type and identify marker genes for each subpopulation of cells.
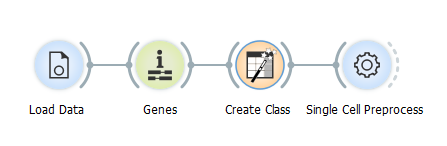
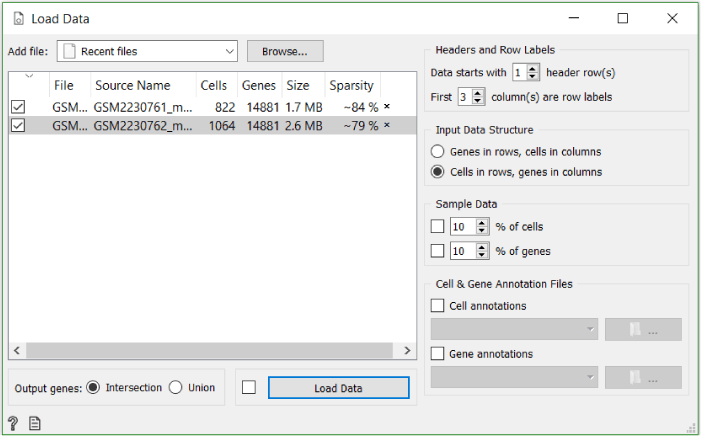
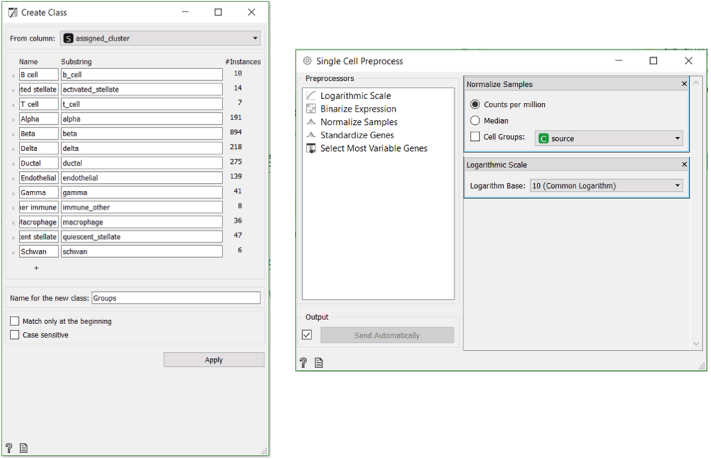
Firstly, we need to load, organise and nominalise our data. To achieve this, we use the Load Data widget followed by the Genes (don’t forget to set organism to Mus Musculus) and the Create Class widget, which enables us to use the cell types as characterised by Baron et al. as a control of our clustering. We normalise the data using the Single Cell Preprocess widget. Alternatively you can use Single Cell Datasets widget and load the Pancreas cells in mouse dataset with it.
Once the data has been normalised, we utilize the Louvain Clustering widget to cluster our cells. We adjust the resolution so that the clustering produces 13 clusters, since this is the number of cell types described in mouse pancreas in literature.
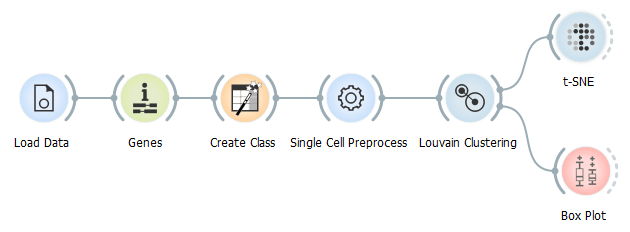
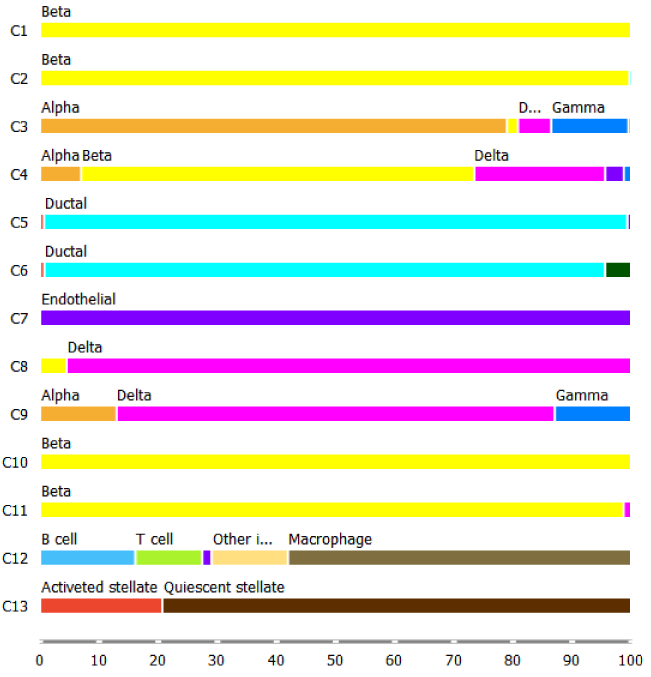
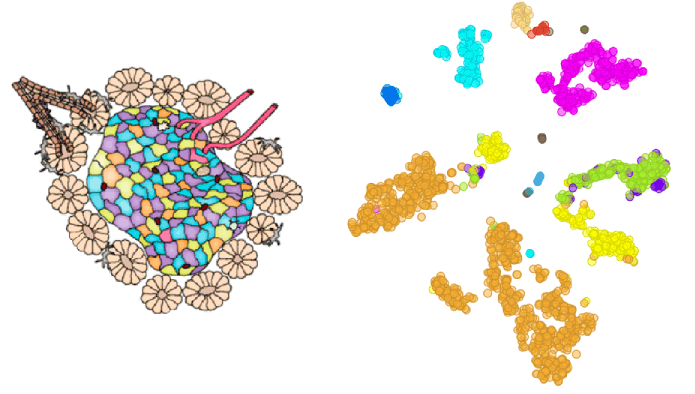
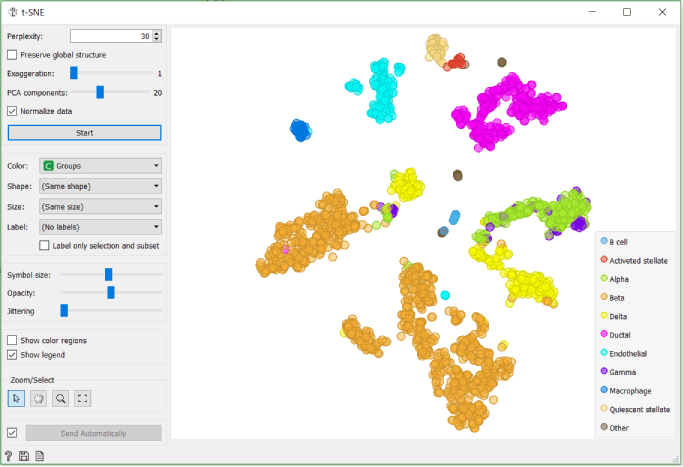
We check the accuracy of clustering with the box plot and t-SNE where we use Groups that we crated with the Create Class widget in the previous step to colour cells.
The only thing we still need to do now is to identify the marker genes. There is no specific widget in scOrange to accomplish this task, so we will use similar steps as the ones used in the article by Baron et al. to find the three most significant markers for each cluster and create a heatmap with them.
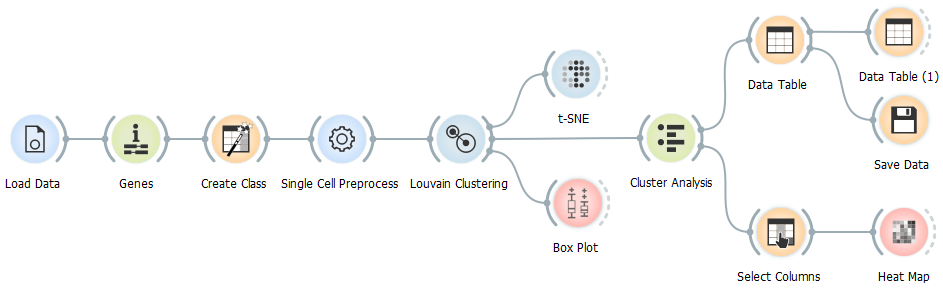
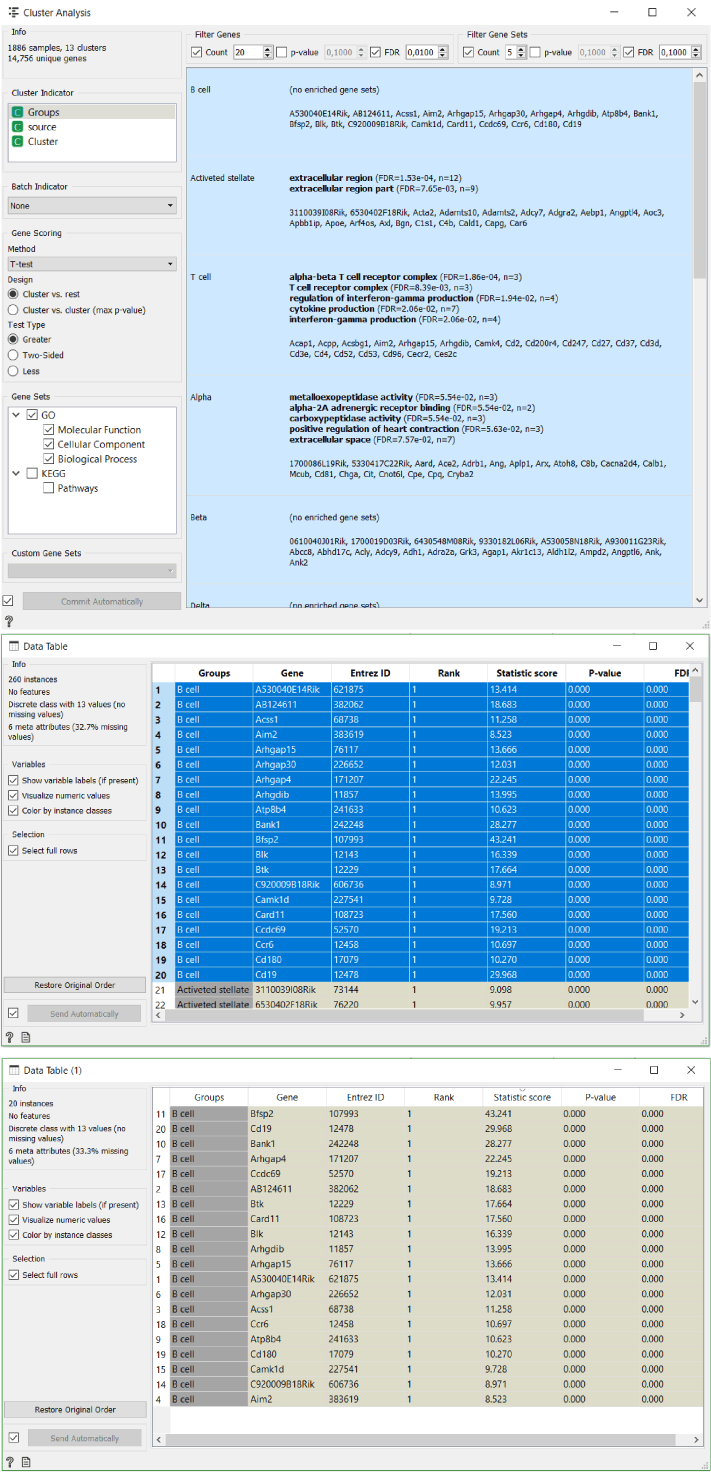
The best way to approach this is to firstly run a Cluster Analysis widget. We can see that Orange already recognises some of the gene clusters associated with different groups of cells. For example, T cell receptor complex genes correlate with T cells.
Secondly, we transfer the gene score data produced by the widget into a new data table. Then we transfer the data for one cluster into a new data table where we organise it by the descending statistic score in order to identify top three most significant genes in this cluster.
After we have identified all the marker genes, we select and save them using the Save Data widget for additional processing, which will be further explored in the next blog.
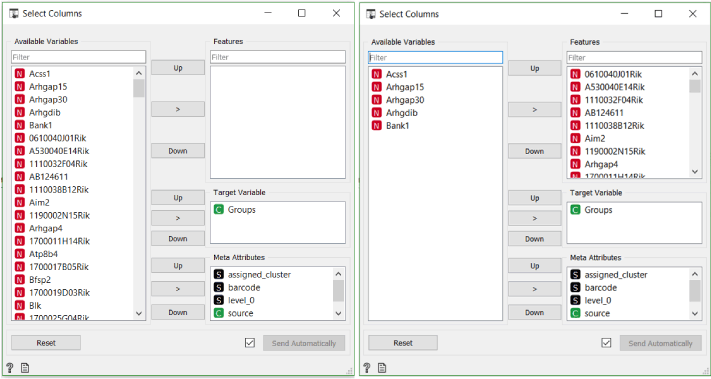
We use Select Columns widget to extract marker genes for heatmap. To do this, we manually search for the genes in Available Variables and transfer our marker genes into the features section.
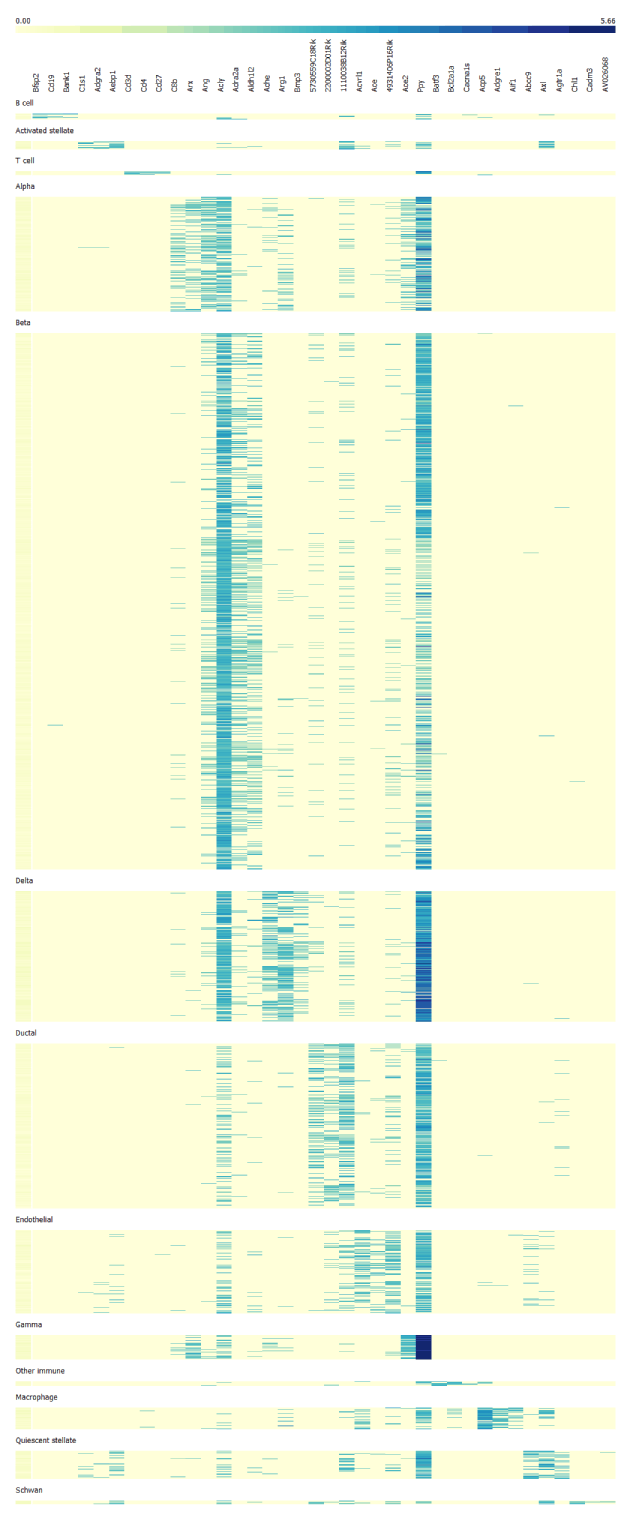
Finally, we use selected genes to create the heatmap. From it we can identify cell clusters by looking at the functions of the marker genes. Alpha cells are most strongly correlated with GCG encoding glucagon, beta cells with INS1 and INS2 encoding insulin, delta cells with SST encoding somatostatin, gamma cells with PPY encoding pancreatic polypeptide.
Using this principle we can cluster large bulks of cells into different cell type identities by identifying their marker genes and maping cell clusters according to functional roles of their marker genes.
References
Baron M., Veres A., Wolock S.L., et al. A Single-Cell Transcriptomic Map of the Human and Mouse Pancreas Reveals Inter- and Intra-cell Population Structure. Cell Syst. 2016;3(4):346–360.e4. doi:10.1016/j.cels.2016.08.011