Data Visualization with t-SNE
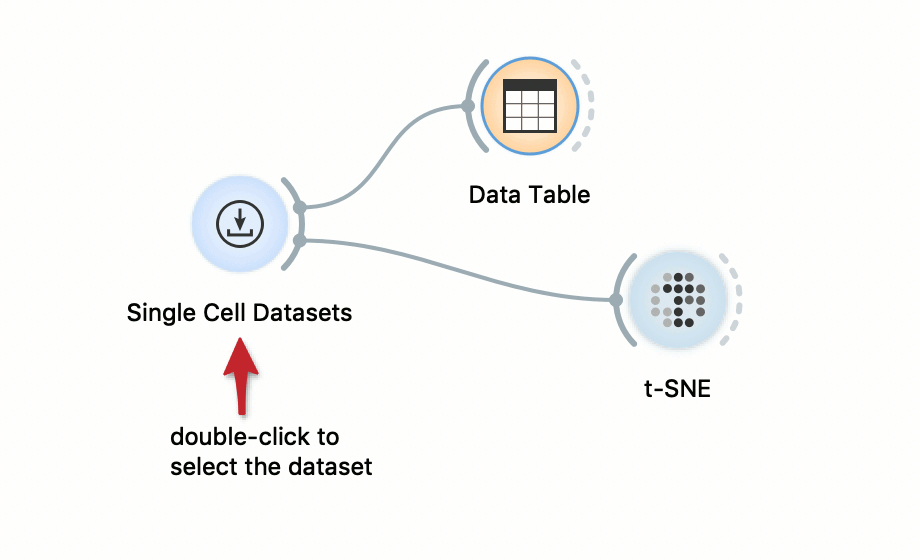
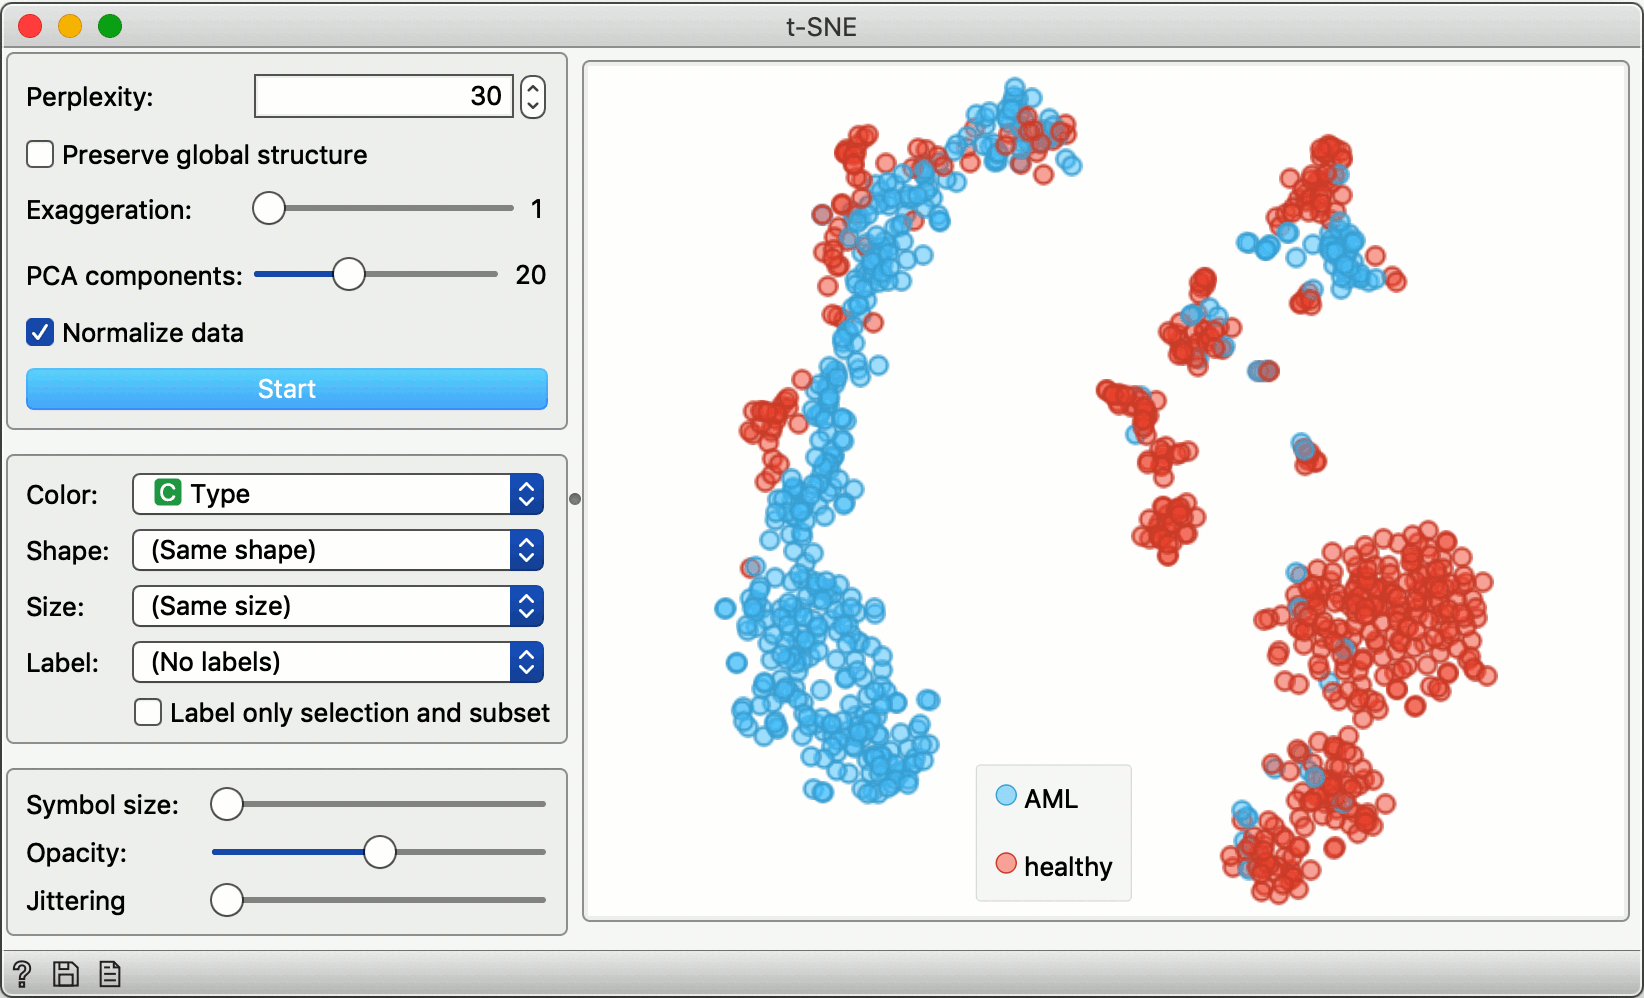
Loads the data from scOrange’s single-cell datasets server and feeds it into a spreadsheet viewer and a t-SNE visualization. To see the raw data, double click on the Data Table widget. Double click on the t-SNE widget to display the cell landscape.