Embryonic development has been well studied in mouse models but our knowledge of this process in the human embryo is rudimentary. Here we will take a closer look at the trophectoderm and the inner cell mass maturation during the first 7 days of human development to help with the assessment of the degree of conservation between the mouse and human blastocyst formation.
We will be using the same single cell data from human preimplantation embryos as in the previous blog. The data was published by Petropoulos et al. and is deposited in ArrayExpress database under the accession number E-MTAB-3929.
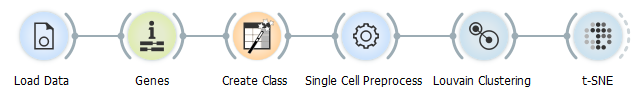
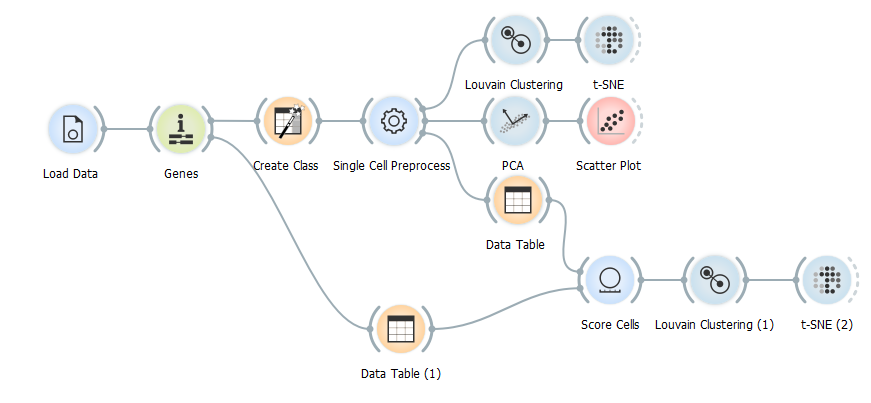
Naturally, we have to start by loading the data into Orange and pre-processing it using the familiar workflow with the following widgets: Load Data, Genes, Create Class to sort the cells by sampling day and of course Single Cell Preprocess to normalise the data and select the 500 most variable genes. Alternatively, you can load the Human preimplantation embryos dataset using Single Cell Datasets widget.
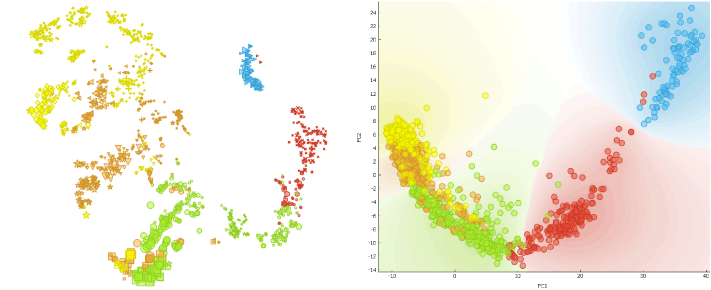
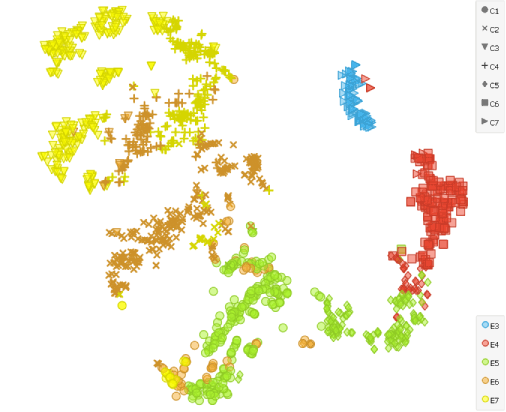
To show that the cells’ expression changes with time, we cluster the cells using the Louvain Clustering widget with resolution set to 1.7 and k-neighbours to 100. t-SNE distinctly depicts 7 clusters. E4 and E5 samples are slightly divided, which complies with the fact that Petropoulos et al. sampled those cells at two occasions 4-6 hours apart.
Another way to confirm that time plays a crucial role in the cell segregation is by using the Principal Component Analysis (PCA) widget.
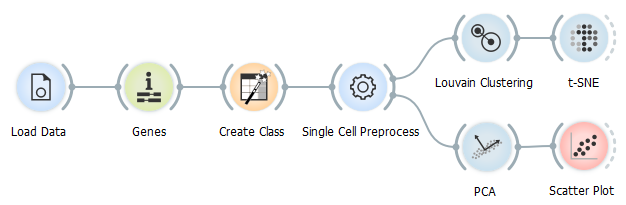
Scatter Plot widget reveals that cells are clearly aligned in the accordance with the time of development (embryonic day) when dimensionally reduced, meaning that time is one of the prevalent factors for segregation.
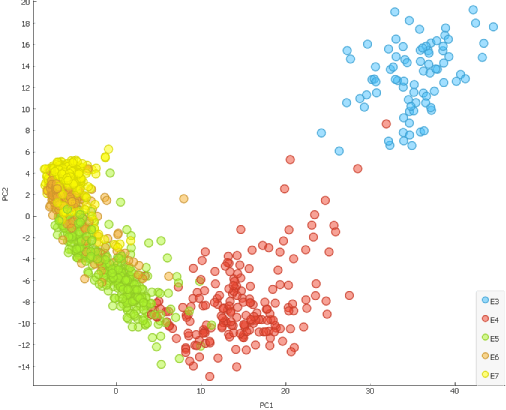
Additionally, we can explore another strong segregating factor which takes place during E5 and causes scatter plot to distinctly change shape. Since this timeline corresponds with blastocoel formation, we could try scoring the cells for trophectoderm (TE) and inner cell mass (ICM) gene markers and check whether this is the reason behind segregation of the cells on the scatter plot.
Firstly we need to export genes into a new data table. In it we select GATA2 and GATA3 as the markers for TE and SOX2 plus PDGFRA for ICM cells and use them as gene input for the Score Cells widget.
As the second input we need to select all the cells in the Data Table widget that contains normalised data. After that we cluster the cells using the similar settings as before (k-neighbours: 100, resolution: 1.6) to elicit 8 clusters (5 for each sampling day and three additional ones to separate E5, E6 and E7 to ICM and TE cells).
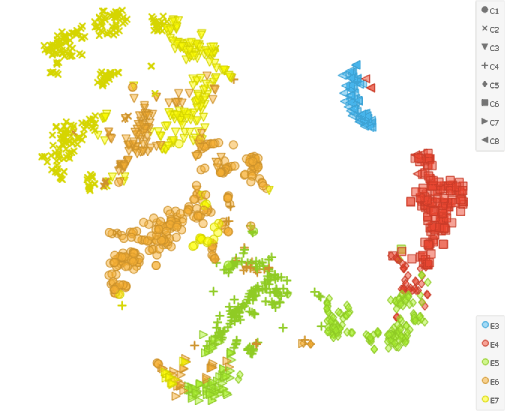
tSNE projection reveals that the cells sampled on 5th (E5), 6th (E6) and 7th (E7) day separate into two different clusters, but is not considerably different form tSNE that is not preceded by the Score Cells widget that takes into account the TE and ICM marker genes.
We could try running two Score Cells widgets consecutively; first scoring cells as TE (GATA2, GATA3), the second scoring cells as ICM (SOX2, PDGFRA). Additional benefit of this approach is that we will turn cell scores into two variables and consequently be able to display them on the scatter plot.
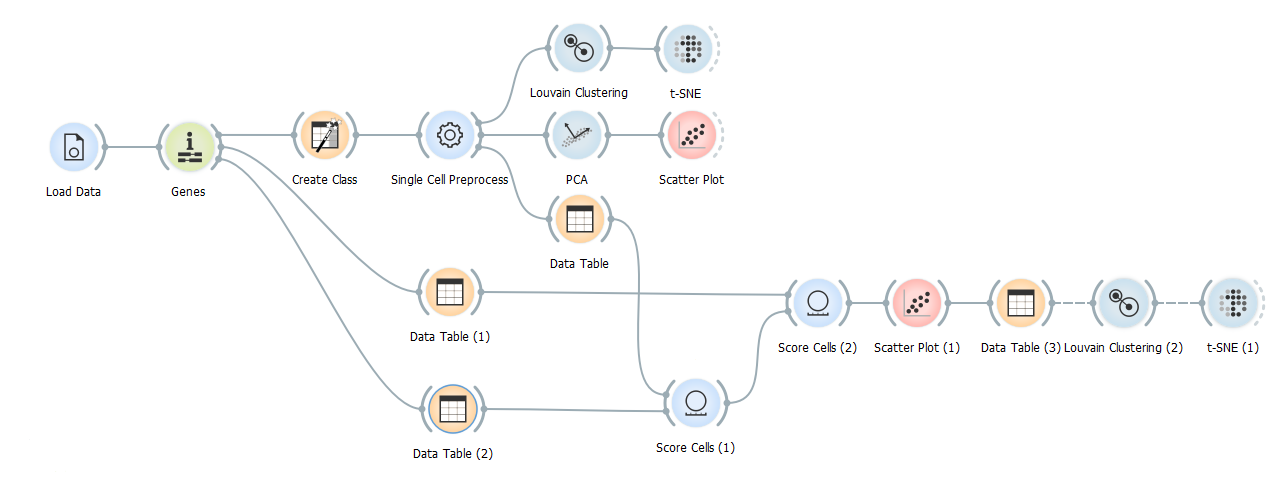
We can now appoint TE and ICM scores on the X and Y axis of a scatter plot.
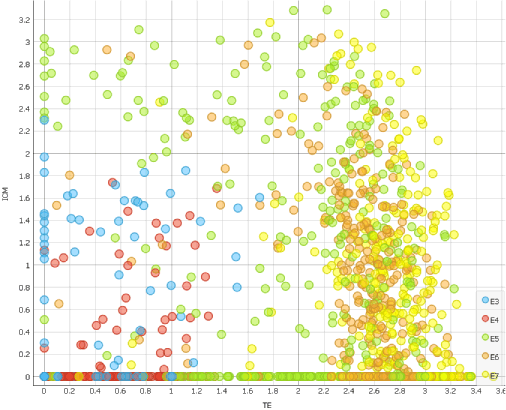
Observing which cells score high for TE and ICM markers, we can see that cells really do enter blastocoel formation on the 5th day.
To illustrate that even more evidently, we cluster (k-neighbours: 100, resolution: 1.6) and display them with the t-SNE widget. We set ICM score as a sizing factor. The lineage differentiation is well visible in the projection since about half of the cells in E5, E6 and E7 diplay higher scores for ICM.
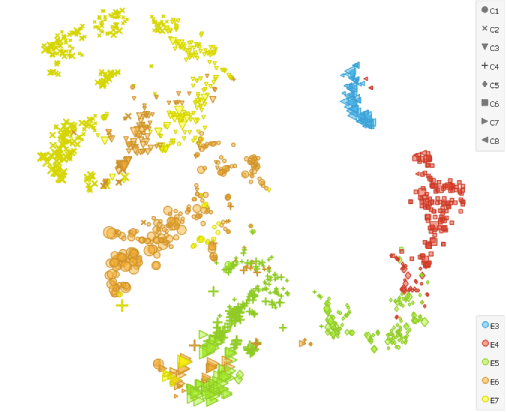
Combining principal component analyses (PCA) with clustering, this analysis of human preimplantation embryos indeed revealed that the segregation into TE and ICM lineages occurs at E5.
References
Petropoulos, S., Edsgärd, D., Reinius et al. (2016). Single-Cell RNA-Seq Reveals Lineage and X Chromosome Dynamics in Human Preimplantation Embryos. Cell, 165(4), 1012–1026.