We have already demonstrated how to identify the cell types using marker genes in our previous blog. Today we will apply the same principle to determine the biological sex of human preimplantation embryos sampled by Petropoulos et al. (Cell, 2016) and examine the time of Y chromosome activation.
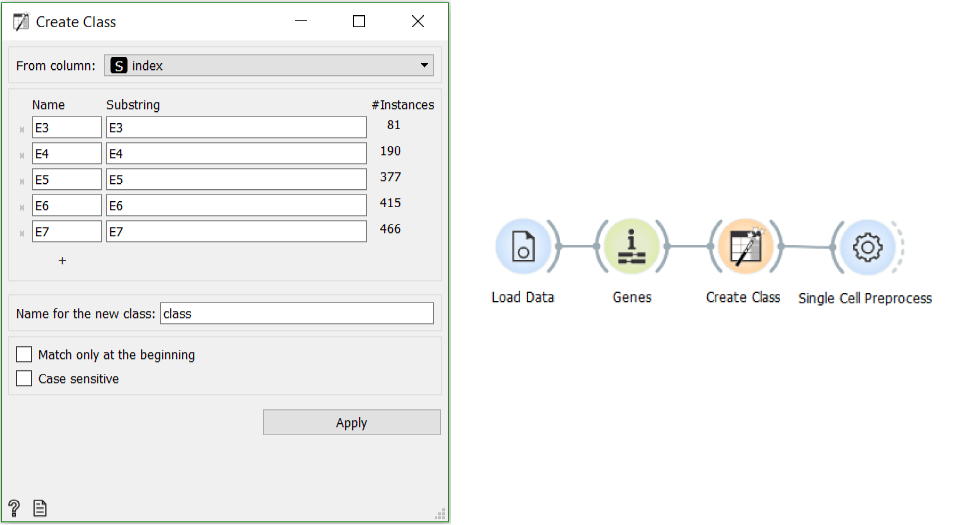
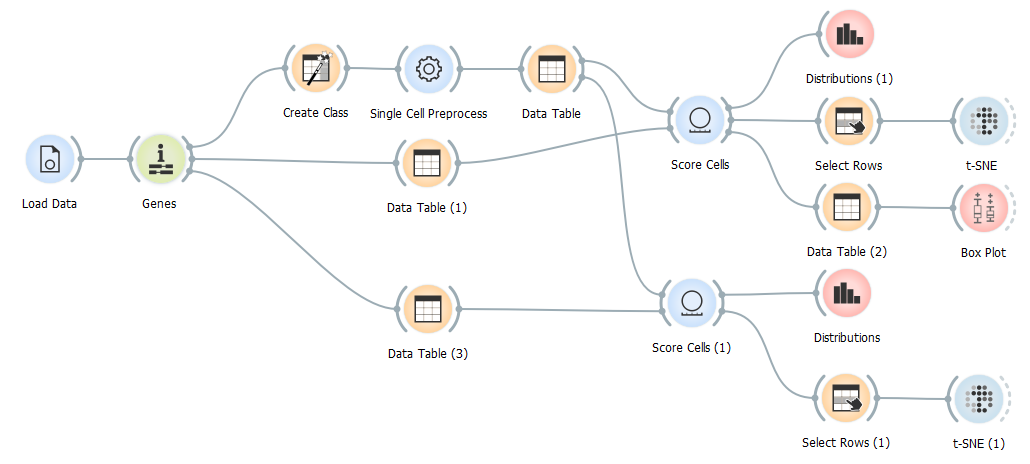
The data we need for this example is deposited in ArrayExpress database under the accession number E-MTAB-3929 . This single cell data was collected from human preimplantation embryos at different timepoints. We can import it into Orange using the Load Data widget, followed by the Genes widget. Alternatively, you can load the human preimplantation embryos dataset using the Single Cell Datasets widget. Employing the Create Class widget helps us to classificate cells based on the sampling day.
We are now ready to dive into a more demanding task of separating cells based on their biological sex. In order to do that, we need to score cells based on X- and Y-linked genes. We shall start with the Y-linked genes. Firstly, we connect a new Data Table widget from the data we normalised so far and use it as the first input for the Score Cell widget. As the second input, we select Y-linked genes (AMELY , DAZ1, Ddx3y, EIF1AY, KDM5D, PCDH11Y, RBMY1A1, RPS4Y1, RPS4Y2, SRY , TSPY1, USP9Y, UTY, ZFY) in a separate Data Table into which we have imported the genes from the Genes widget.
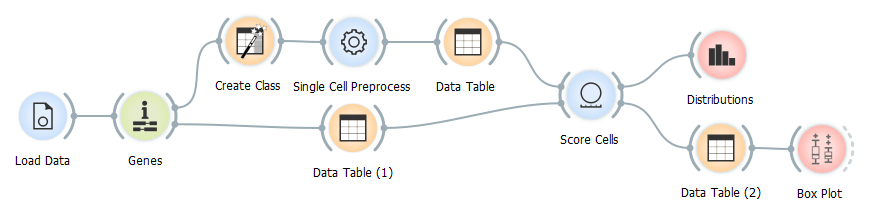
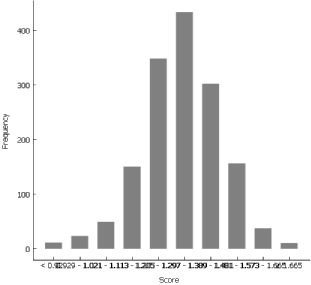
Distribution widget is the most fitting way to depict the scores.
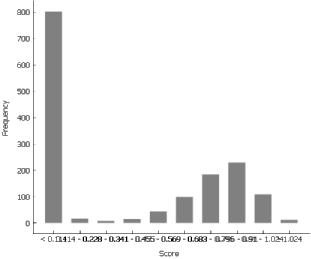
Observing the outcome, we can quickly deduce that the bar on the far left is representative of the cells with the XX karyotype and the rest represent cells from the male embryos.
To check whether the Y-linked genes are ubiquitously expressed at all stages of preimplantation embryos, we foremost have to elect the cells with the XY karyotype. We utilise the Data Table widget and sort the cells according to their score for Y-linked genes. Judging from the distribution, a good cut off mark for the XY cells seems to lie between 0.1 and 0.2, therefore we select the cells with the score of at least 0.2. The Box Plot widget reveals an increase between E3 (day 3) and E4 (day 4).
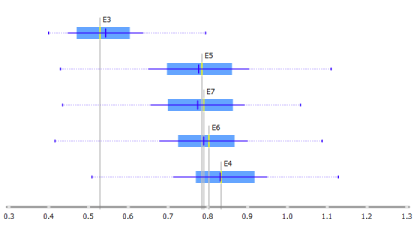
As demonstrated by Petropoulos et al. this is due to incomplete zygotic genome activation at E3, since the cells at this stage still contain lingering maternal transcripts.
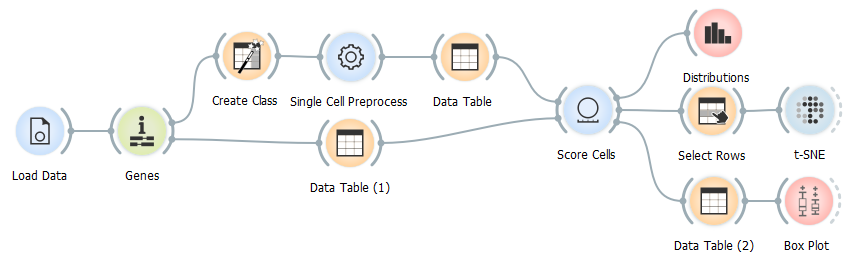
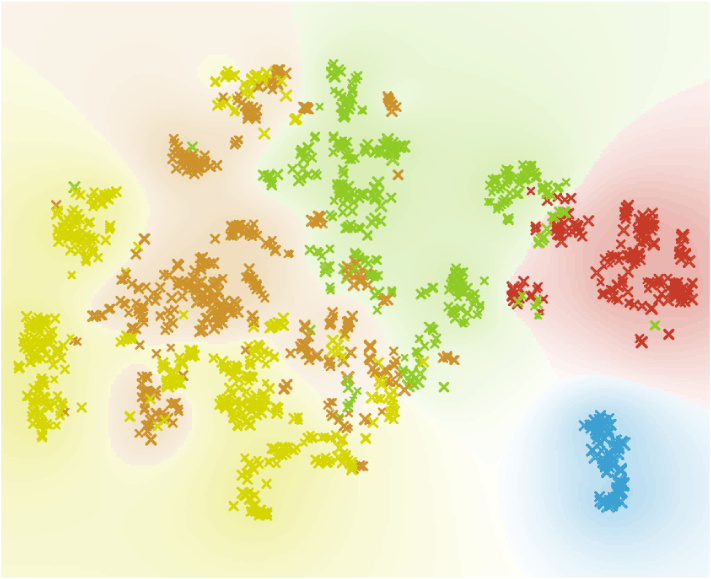
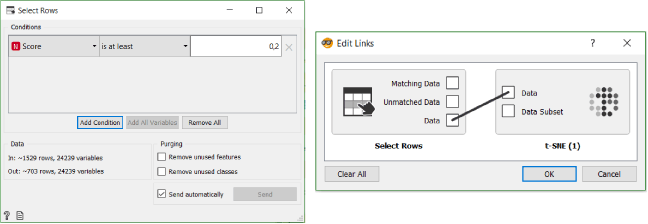
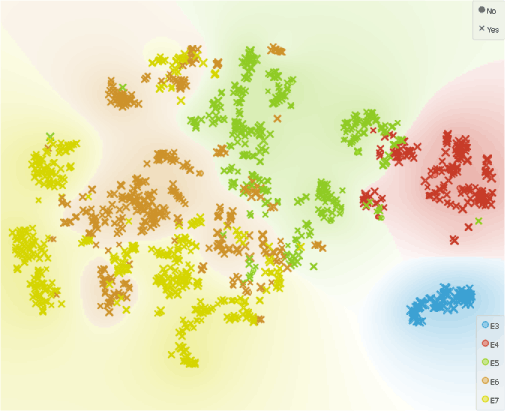
The best way to visualise the cells, we determined to have XY karyotype, is t-SNE. To separate cells with the XY karyotype from those with the XX karyotype, we use the Select Rows widget. We select the same cut off mark for the XY cells as before: 0.2, then proceed to transfer all the data from the Select Rows widget to t-SNE widget.
In the t-SNE widget we colour cells according to their class, size them according to their score and chose shape to separate the cells with XY karyotype we selected in Select Rows widget from those with XX karyotype.
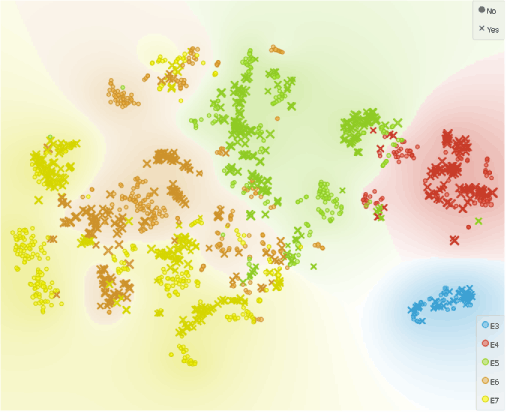
Samples from all timepoints include male (Yes) and female (No) embryos.
Additionally, we can check expression of X-linked genes to exclude any cells with too low overall expression profiles and asses the possibility of the X0 karyotype. We aproach this the same way as before; by selecting X-linked genes (AMELX, DDX3X, EIF1AX,KDM5C, PCDH11X, RPS4X, SOX3, USP9X, UTX) in a separate Data Table and scoring the cells with them.
Some of the cells seem to have suspiciously low expression of X chromosome. A probable reason for this observation could be that at least one of the embryos in this dataset has X0 karyotype.
Most of the cells with X0 karyotype (displayed as No) appear to be in the E5 sampling cluster, which is the exact sampling time where Petropoulos et al. identified one embryo with Turner syndrome.
In conclusion, today we have showed how scOrange can be used to sort cells by karyotype and study time of activation of chromosomes in human preimplantation embryos.
References
Petropoulos, S., Edsgärd, D., Reinius et al. (2016). Single-Cell RNA-Seq Reveals Lineage and X Chromosome Dynamics in Human Preimplantation Embryos. Cell, 165(4), 1012–1026.