scOrange uses workflows and interactive visualizations for single-cell data exploration. Together with Orange, a data mining platform which we have in scOrange upgraded for single cell-specific processing and modeling, scOrange offers an extensive collection of interactive components for explorative data analysis.
Data Visualisation
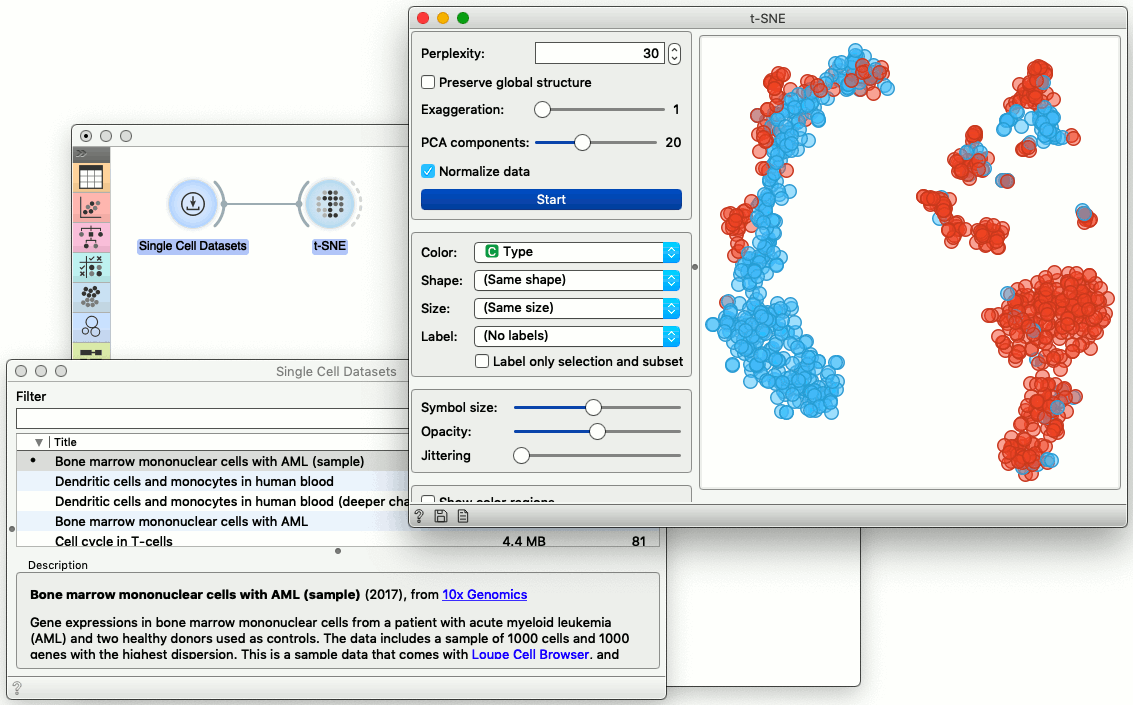
To present the data in a t-SNE plot, we need first to load the data and feed it into t-SNE. In the workflow below, a component called Single Cell Datasets displays a list of ready-to-use single cell data example. We chose the data on bone marrow cells, and feed it into t-SNE component that plots the data in two-dimensional space.
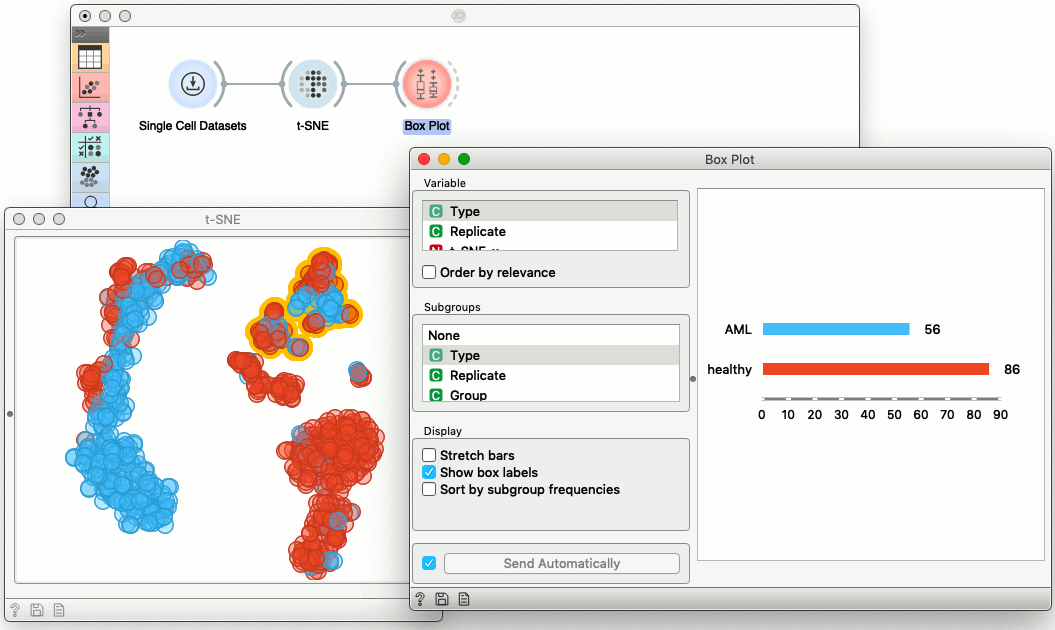
Visualizations in scOrange are interactive. The data we are using here comes from the bone marrow of a patient with leukemia and two healthy donors. We can select a part of the cells in the t-SNE visualization and display the proportion of the healthy cells in the box plot. Notice that any change in the selection of cells would automatically update the box plot display.
Cell Scoring
Components in scOrange are called widgets. We can modify the visualization in the t-SNE plot to expose the cells with expressed marker genes. For this, we need a widget to score the cells according to selected markers, and a widget that would provide us a list of markers.
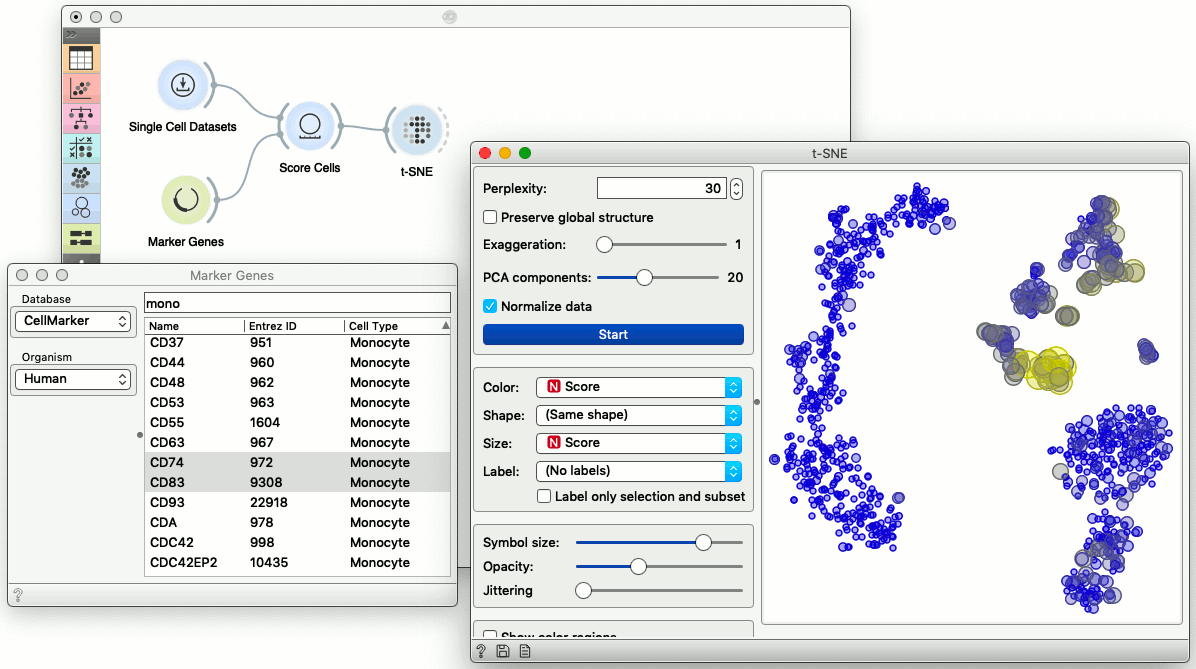
See the yellow cluster in the center of t-SNE visualization? These cells are probably monocytes. Choosing three genes in the Marker Genes widget passes this information to Score Cells, which (by default) scores each cell with the mean expression of the selected marker genes. We could now change the selection of the marker genes, and the t-SNE visualization would be updated automatically. To check what is under the hood, we can also expect the output of the Score Cells widget in the Data Table.
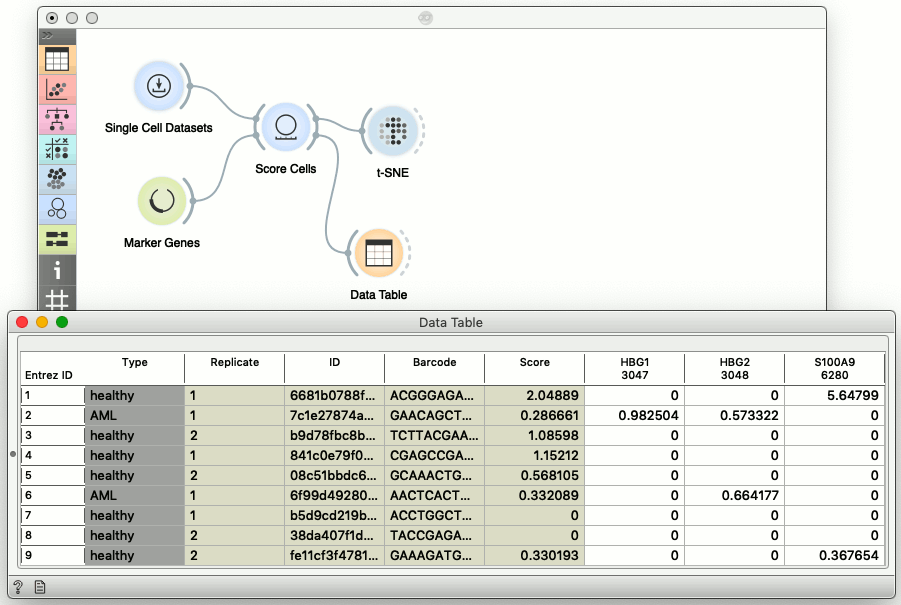
The fifth column in the data table reports on the Score. This attributed was added to the data table by the Score Cells widget, and then used in the t-SNE visualization for the size and the color of the points representing the cells.
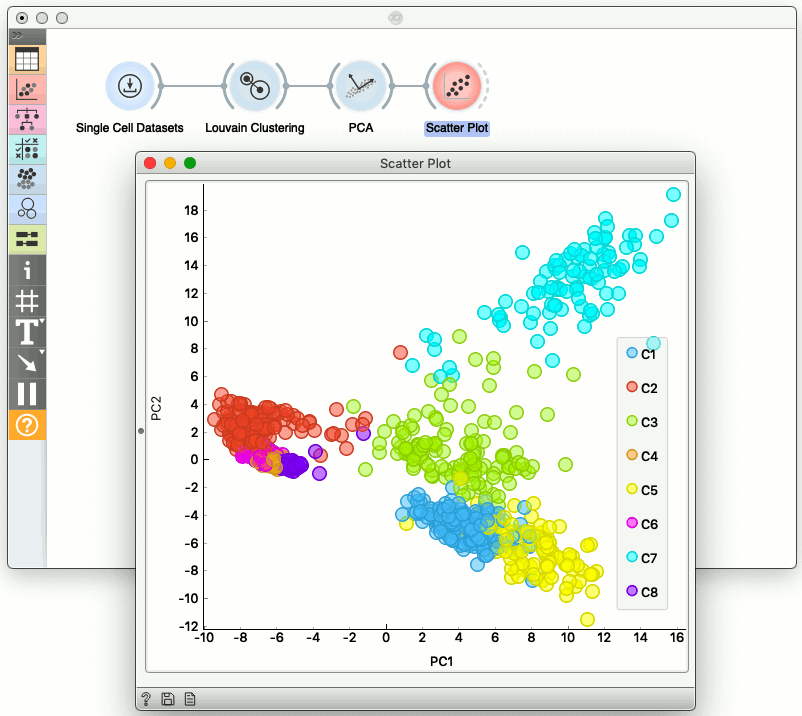
Clustering
We can also cluster the cells in the original space of genes, and then show the clustering results, this time, say, in the PCA space.
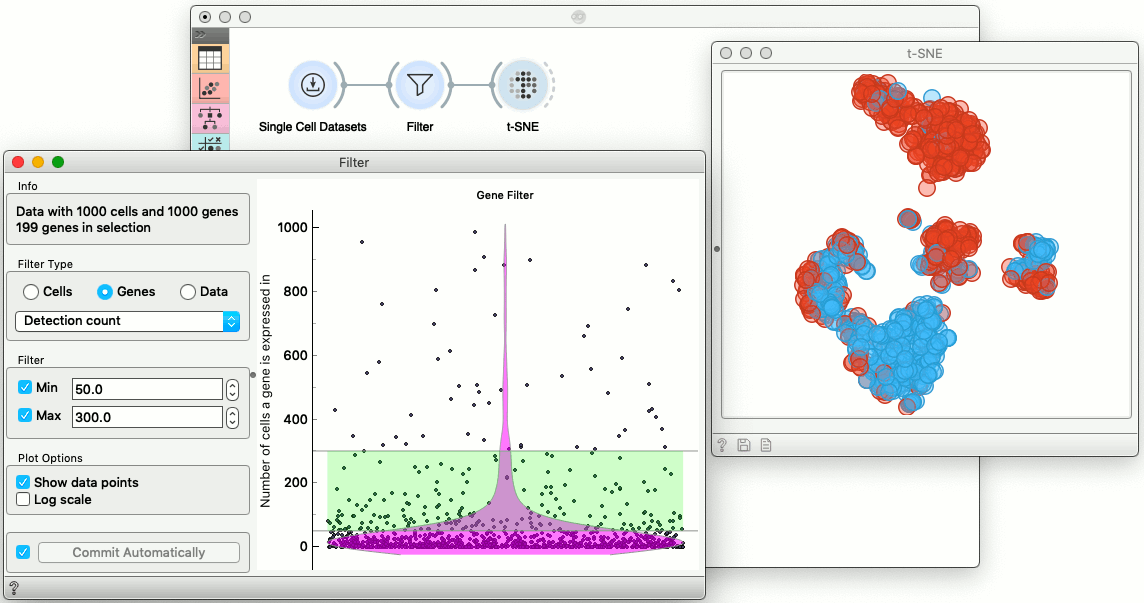
Gene Selection
Single-cell data includes thousands of genes, and some, if not most, maybe not very informative and may be only expressed in a few cells. We can filter them out, along with the genes that are expressed in most of the cells of our data set. The widget for filtering of genes and cells is called, well, Filter, and even though the data set used in our example is already small, it looks like data on a couple of hundred genes is sufficient to obtain a well-structured t-SNE plot.
scOrange includes widgets for preprocessing, data visualization, and modeling, and allows to combine these widgets in any workflow of choice. Importantly, we can always associate any interesting pattern of genes or cells with the original data. Exploring the diversity of the cells becomes a game of constructing the workflow and using interactive visualizations for exposing patterns, cells, and most informative genes.