In scOrange, we can find a cluster of cells and then characterize it with a set of differentially expressed genes. If there is a cell type that is prevailing in our cluster, this technique can be used to find candidates for gene markers.
In other words, we can consider a data set, score cells with a set of known markers, select a subset of cells that express these markers, find genes that are differentially expressed between selected and all other cells, and analyze these genes using, say, gene ontology to perhaps find an ontology term and corresponding genes of our liking. We can use the following workflow for this task.
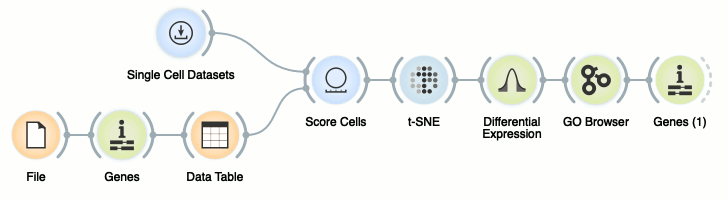
Ok, this was fast. Let us go through this workflow step-by-step, and in the process learn how to define a set of our own markers.
Cells Expressing Custom Set of Marker Genes
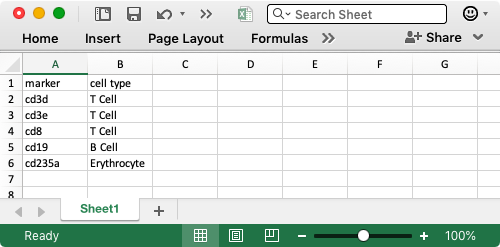
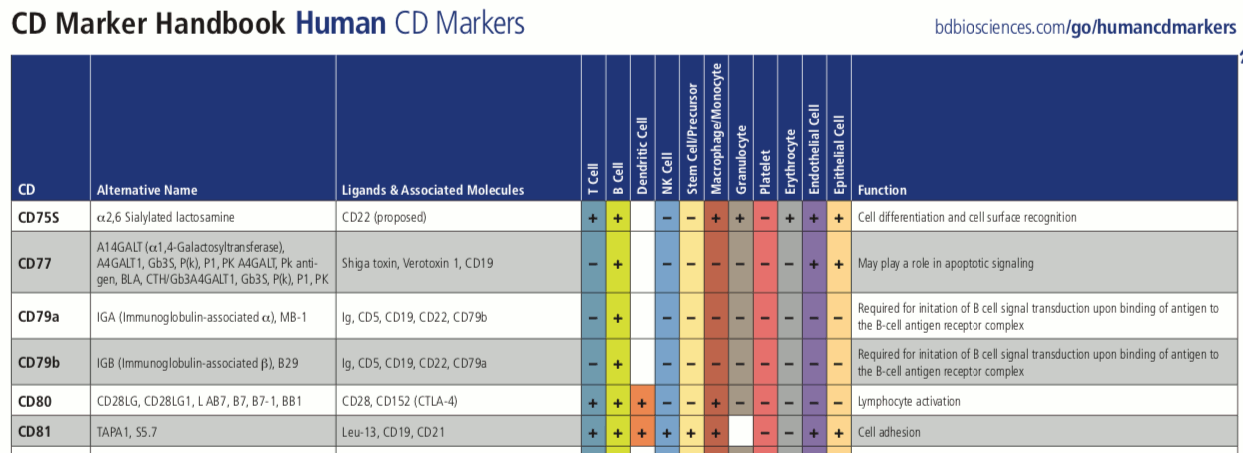
For example, we will here explore the cells from bone marrow mononuclear cells that are readily available from scOrange’s Single Cell Datasets widget. We want to identify the group of B lymphocytes, or B cells, and perhaps some other types of cells. A convenient list of markers from those cells can come from a CD Marker Handbook; we can use to compile a short list of marker genes in Excel:
In scOrange, we load the Excel file, use Gene widget to translate the common gene names into NCBI’s Entrez ID and letting Orange know that these genes are human. Next, we use the data table to display marker genes and cell types and to select a subset of marker genes.
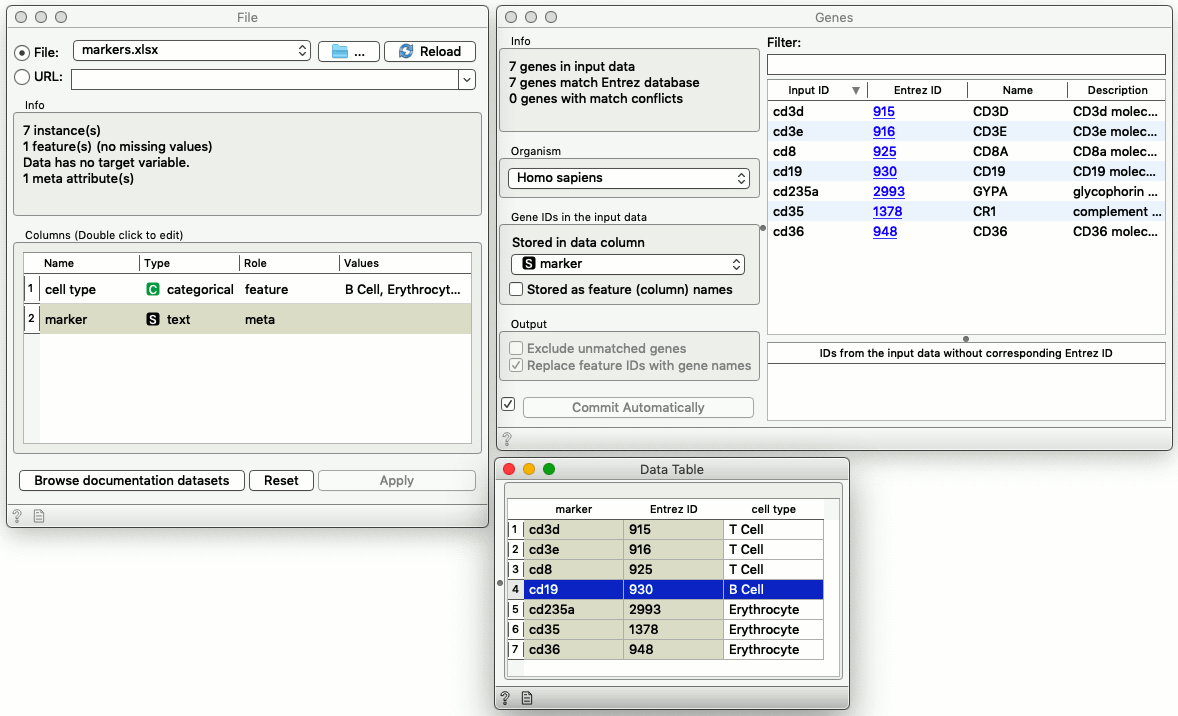
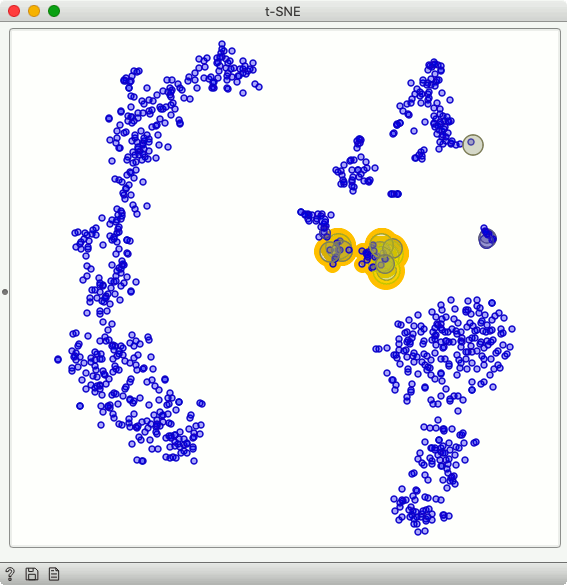
We selected the marker gene for B cells, and use Score Cells to score the cells according to the mean expression of selected marker genes. It turns out that there is a cluster of cells in t-SNE visualization that express this marker. Nice! We select these cells, and we are now ready to characterize them with differentially expressed genes.
Differentially Expressed Genes
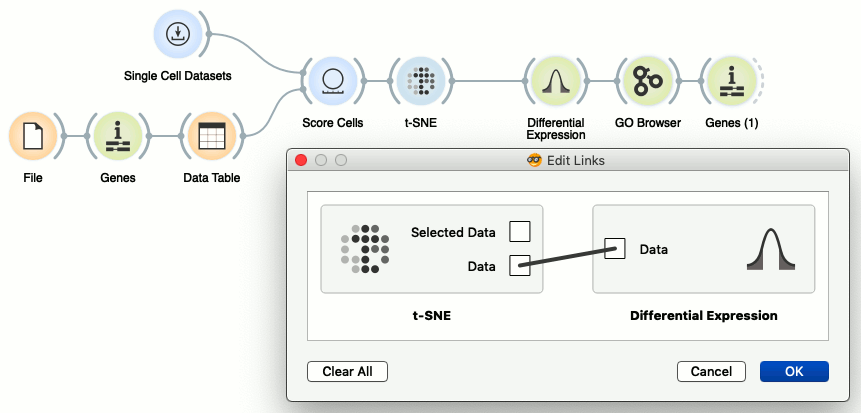
We could characterize cells that have been selected in t-SNE by producing a table with all the data that includes additional feature telling scOrange if the cell was selected or not. Note that by default, t-SNE would output chosen only data items, and to change this we need to rewire the link between t-SNE and Differential Expression widget by double-clicking on the corresponding link, removing the default “Selected Data” to “Data” connection and connecting the “Data” output of t-SNE to the input of differential expression widget.
Differential Expression widget displays the distribution of statistics across genes. Here, we chose that we will score the genes by t statistics that compare their expression in the selected group of cells and cells outside the selection.
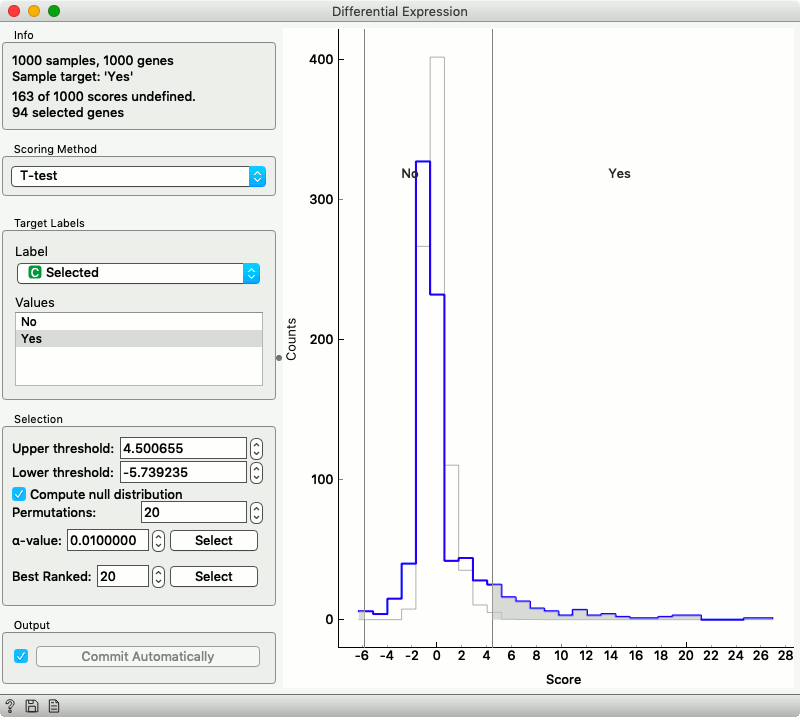
We are interested in the genes in the tail of this distribution, but before giving out their names, let us see if they share any annotations in the Gene Ontology.
Gene Ontology Analysis
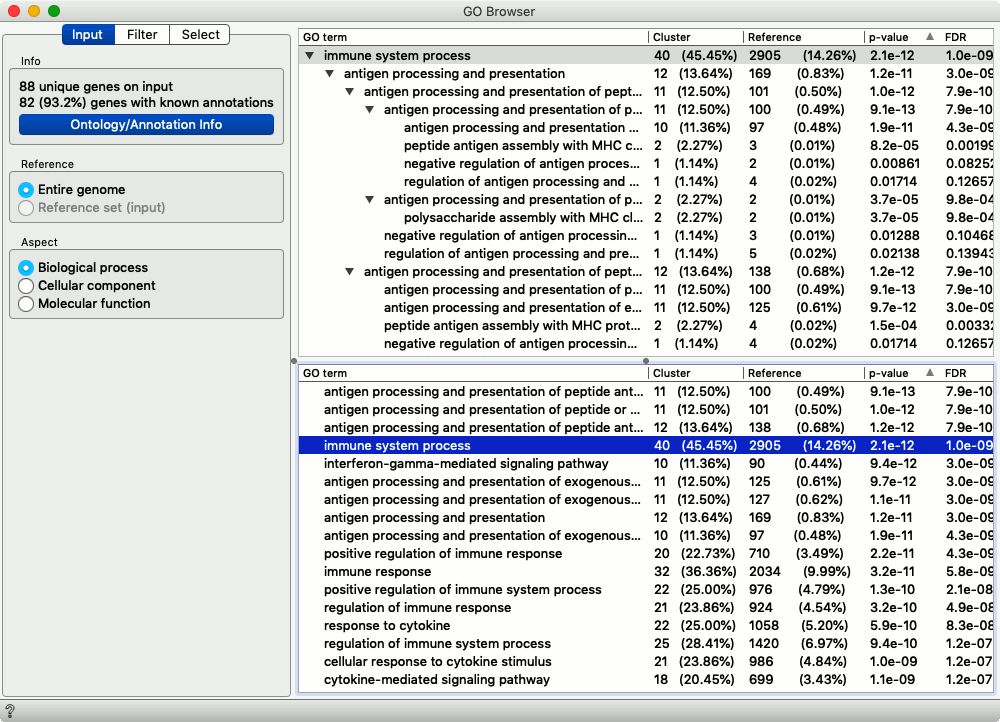
The ninety-four differentially expressed genes share several annotations from Gene Ontology. Most of them are related to the immune process. No wonder: we have selected the cells expressing B lymphocyte marker that are expected to be part of the human immune system.
Finding New Markers
From Gene Ontology, we can select any interesting term and then check its corresponding genes in the Genes widget. We did so for the genes from the immune cell process.
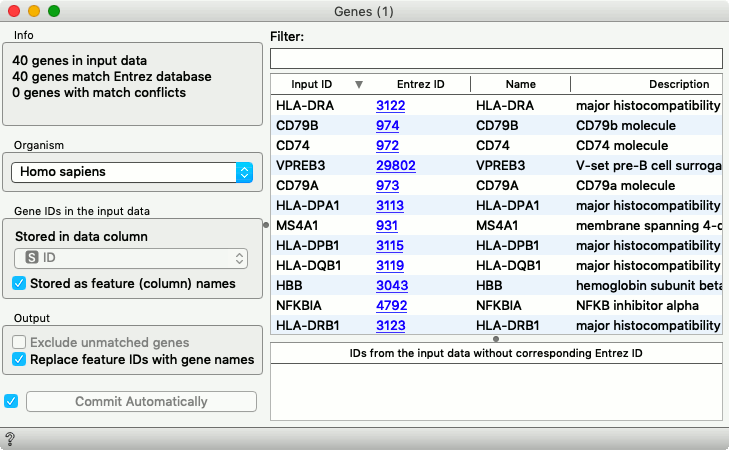
Among these genes is also a gene CD79a, a known marker for the B cells. Oh, what a joy, we just rediscovered it. Here is a corresponding section from a CD Marker Handbook that confirms our result.
The marker that we found has already been known, but this only encourages us to use the same procedure on some other data with more unknowns and differentially expressed genes that have not been characterized yet.