Single-cell RNA sequencing is all about exploring cell subpopulations and their
distinguishing properties. In this blog, you will learn how to automatically
select subset of cells based on different criteria, including generating own
scores. Different subsets will then be explored using previously known, as well
as newly discovered marker genes.
We will work the brain cells from Drosophila melanogaster - a fruit fly,
published in the study if Li et. al (2017). The data set comes with scOrange
via Single Cell Datasets widget.
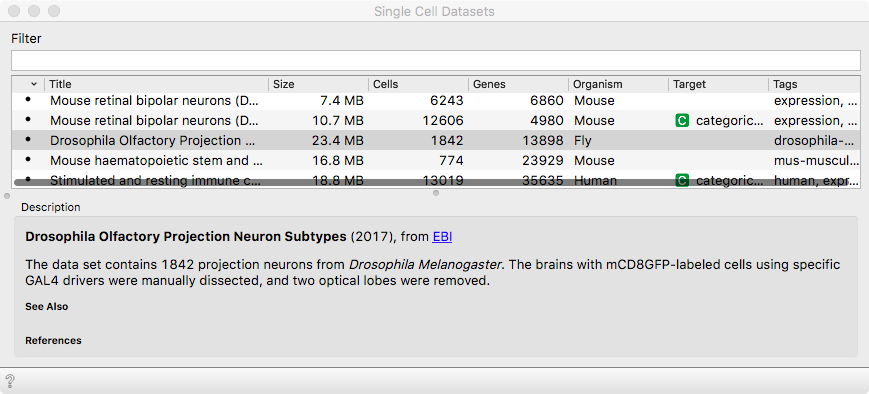
The data set contains more than 1800 cells labelled with different drivers,
that mark different neuronal subtypes, as seen in the Distributions
widget.
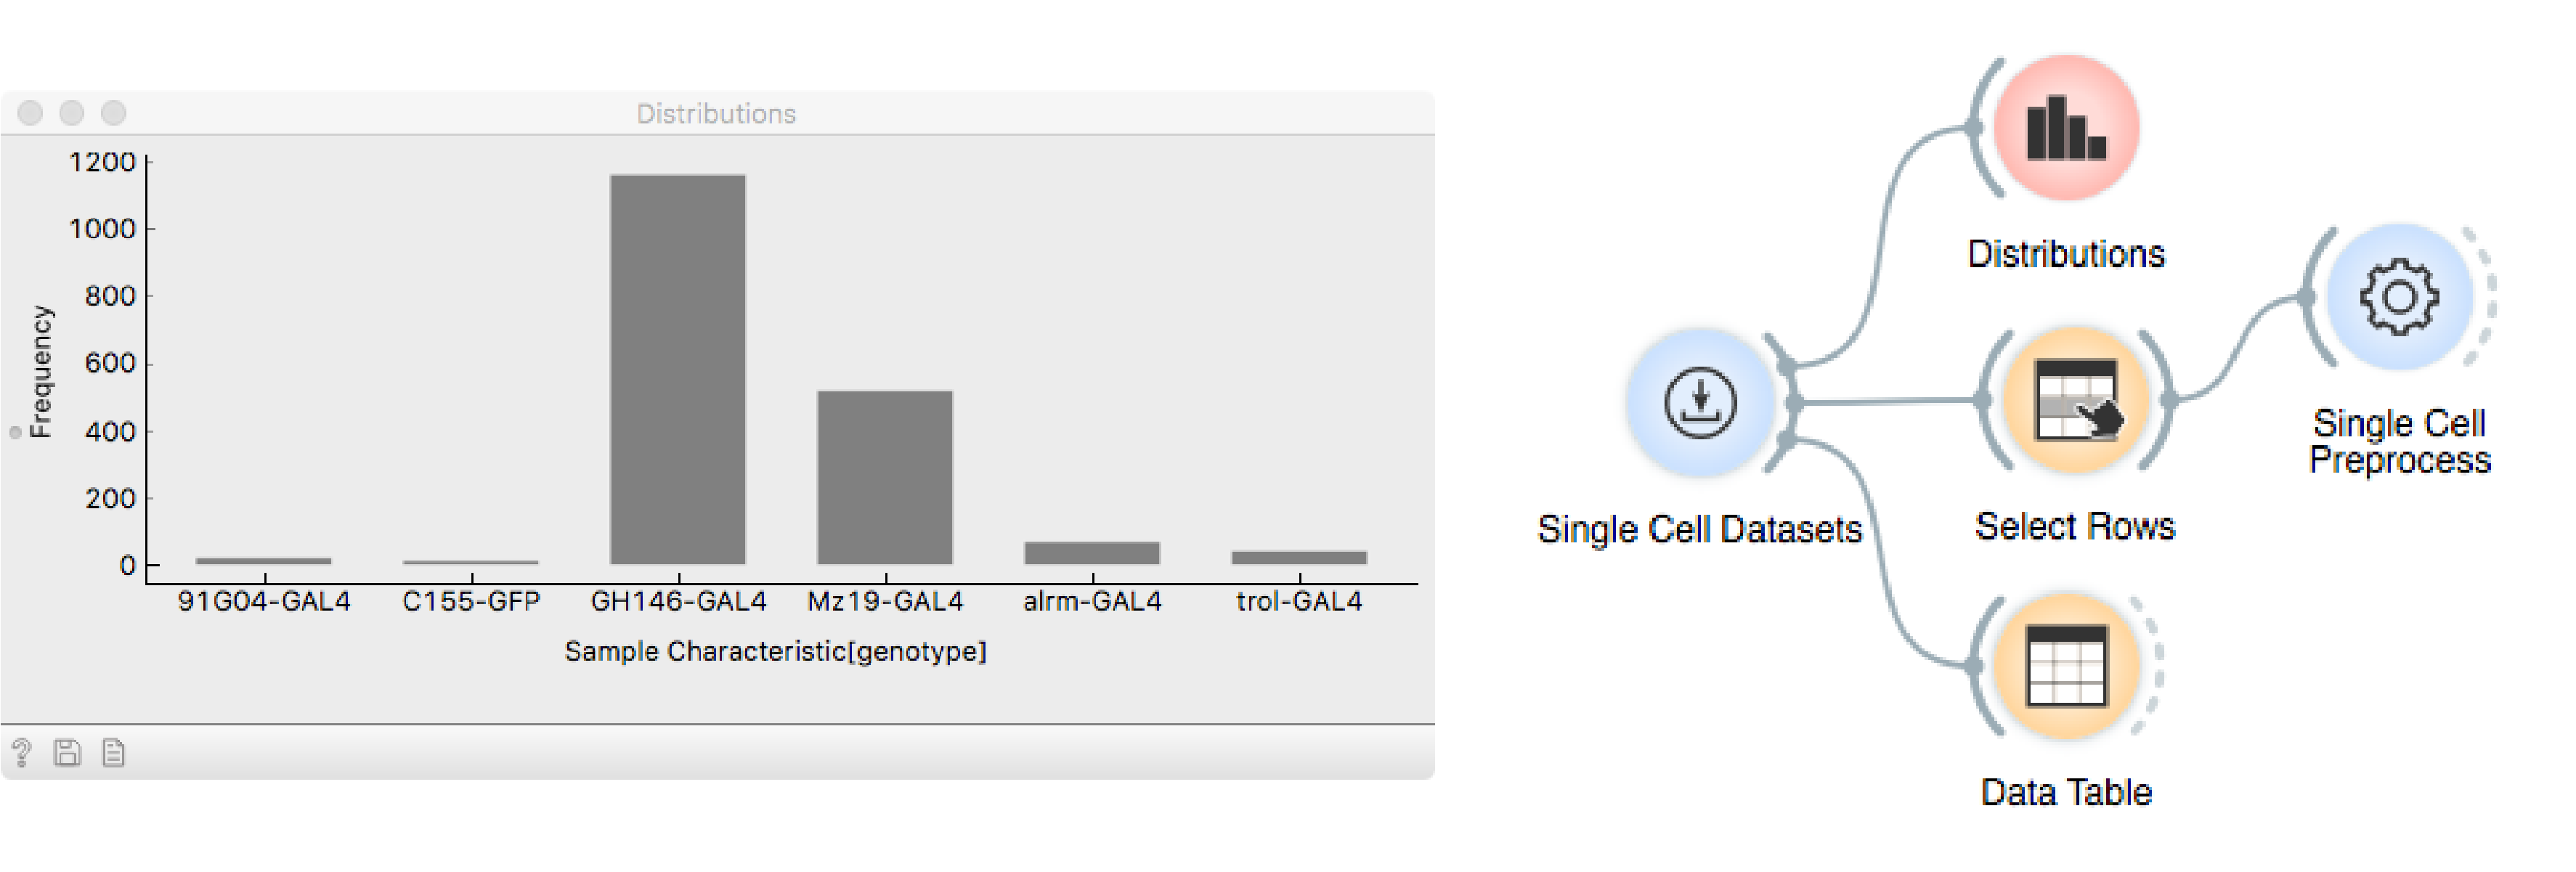
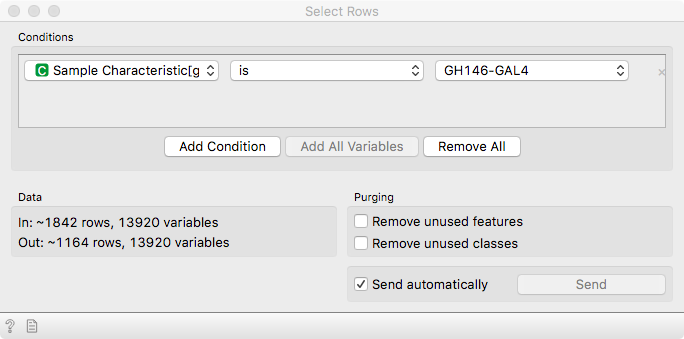
Here, we will focus on cells that are driven by GH146-GAL4, marking olfactory
neurons - the neurons related to the sense of smell. Use Select Rows to subset
the data accordingly.
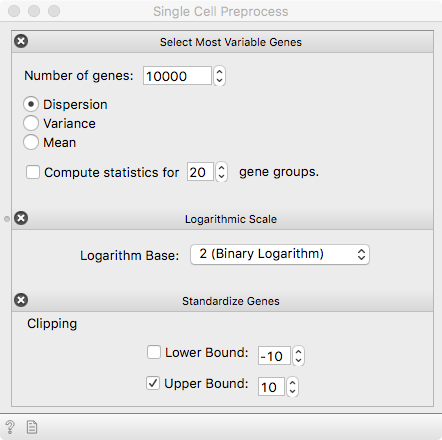
Hardly ever can we escape the preprocessing step. Gene expression is
quantified using counts-per-million (CPM) for each single cell, making the
expression profiles comparable. Select variable genes, use a log transform and
standardize expressions of each gene.
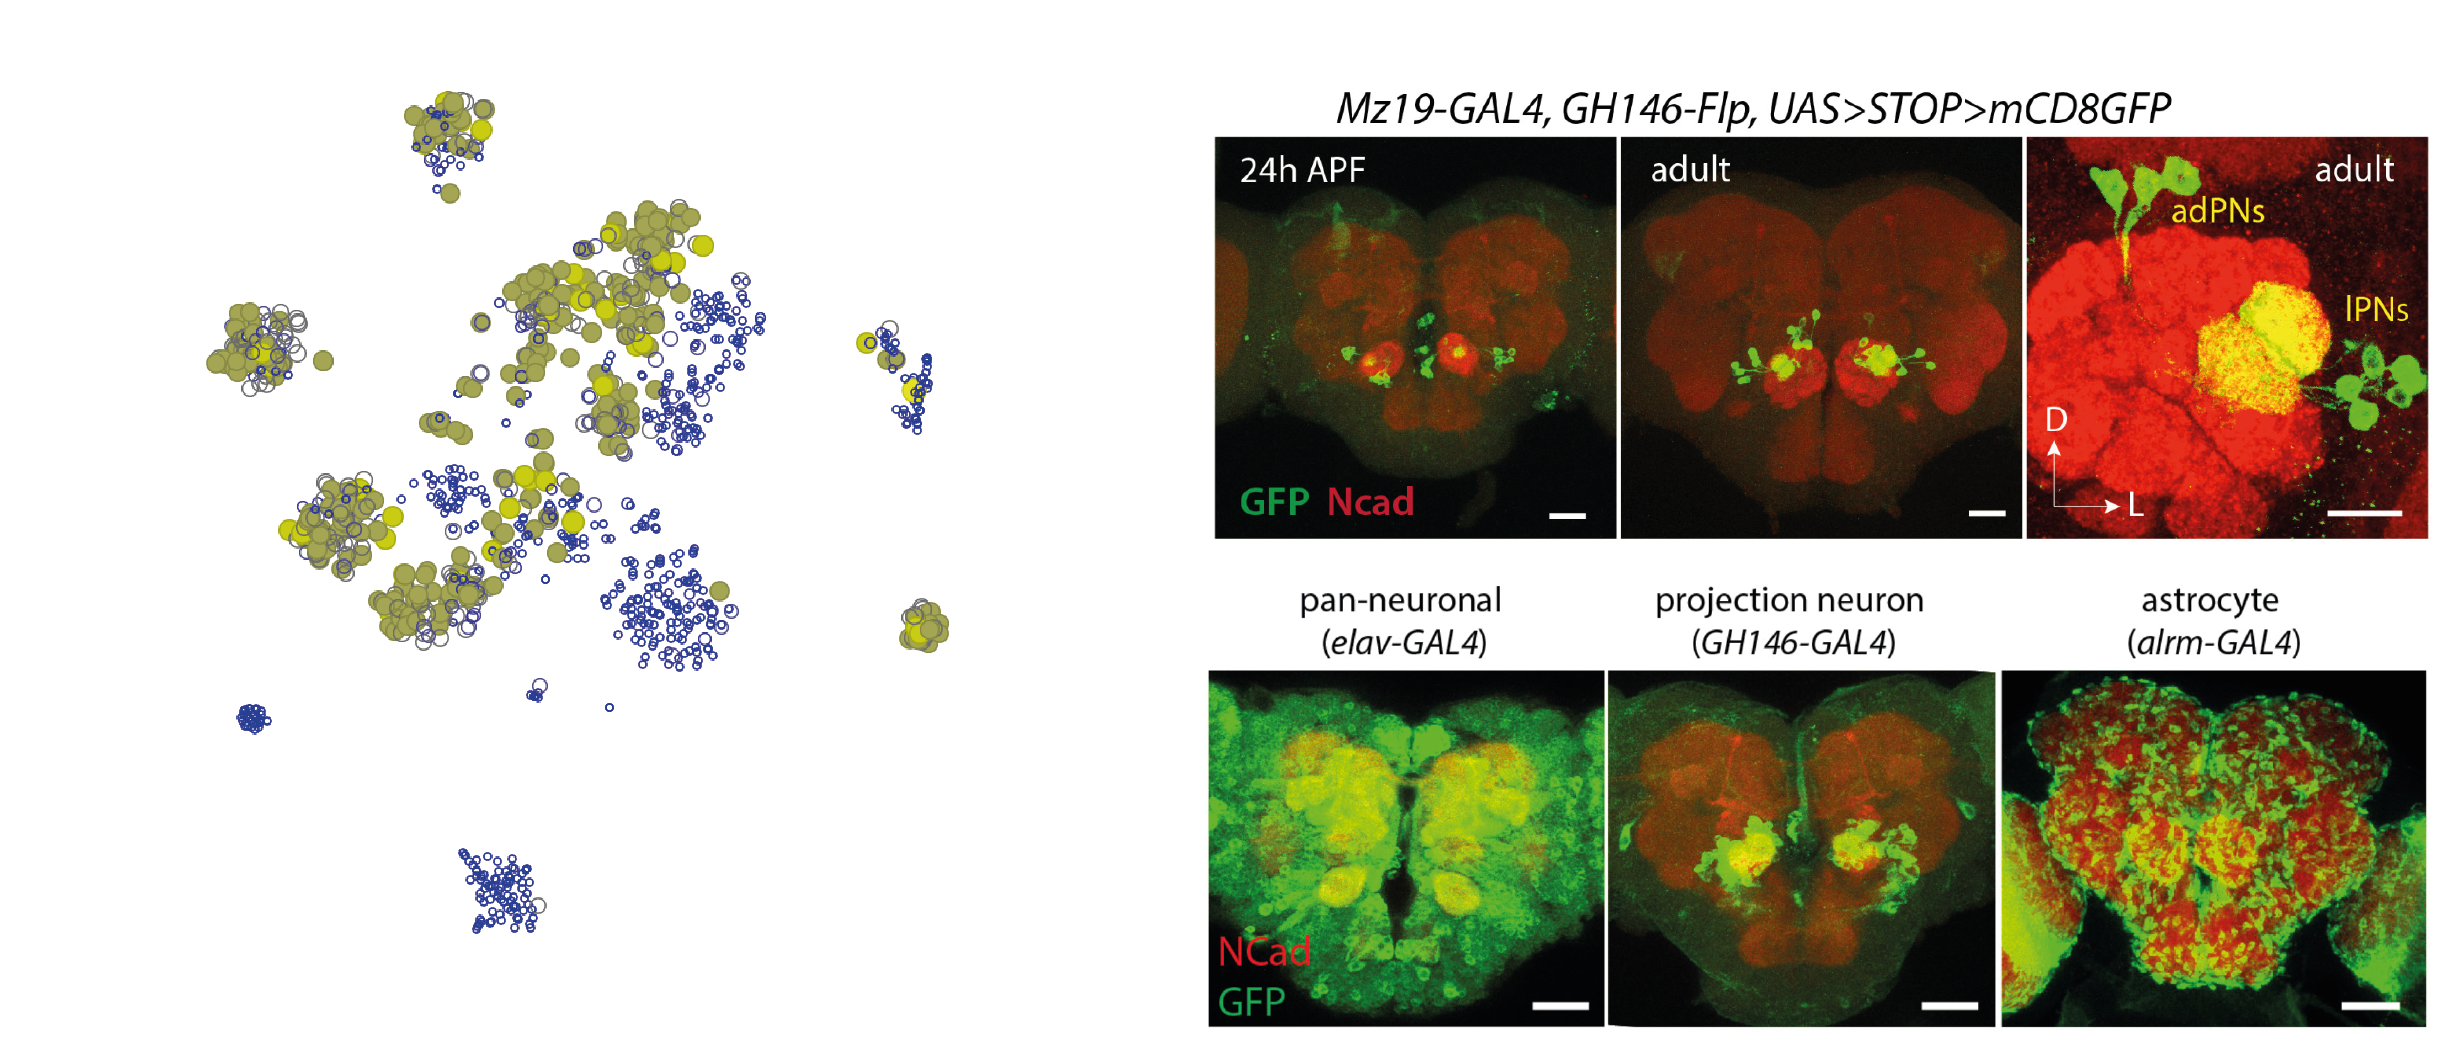
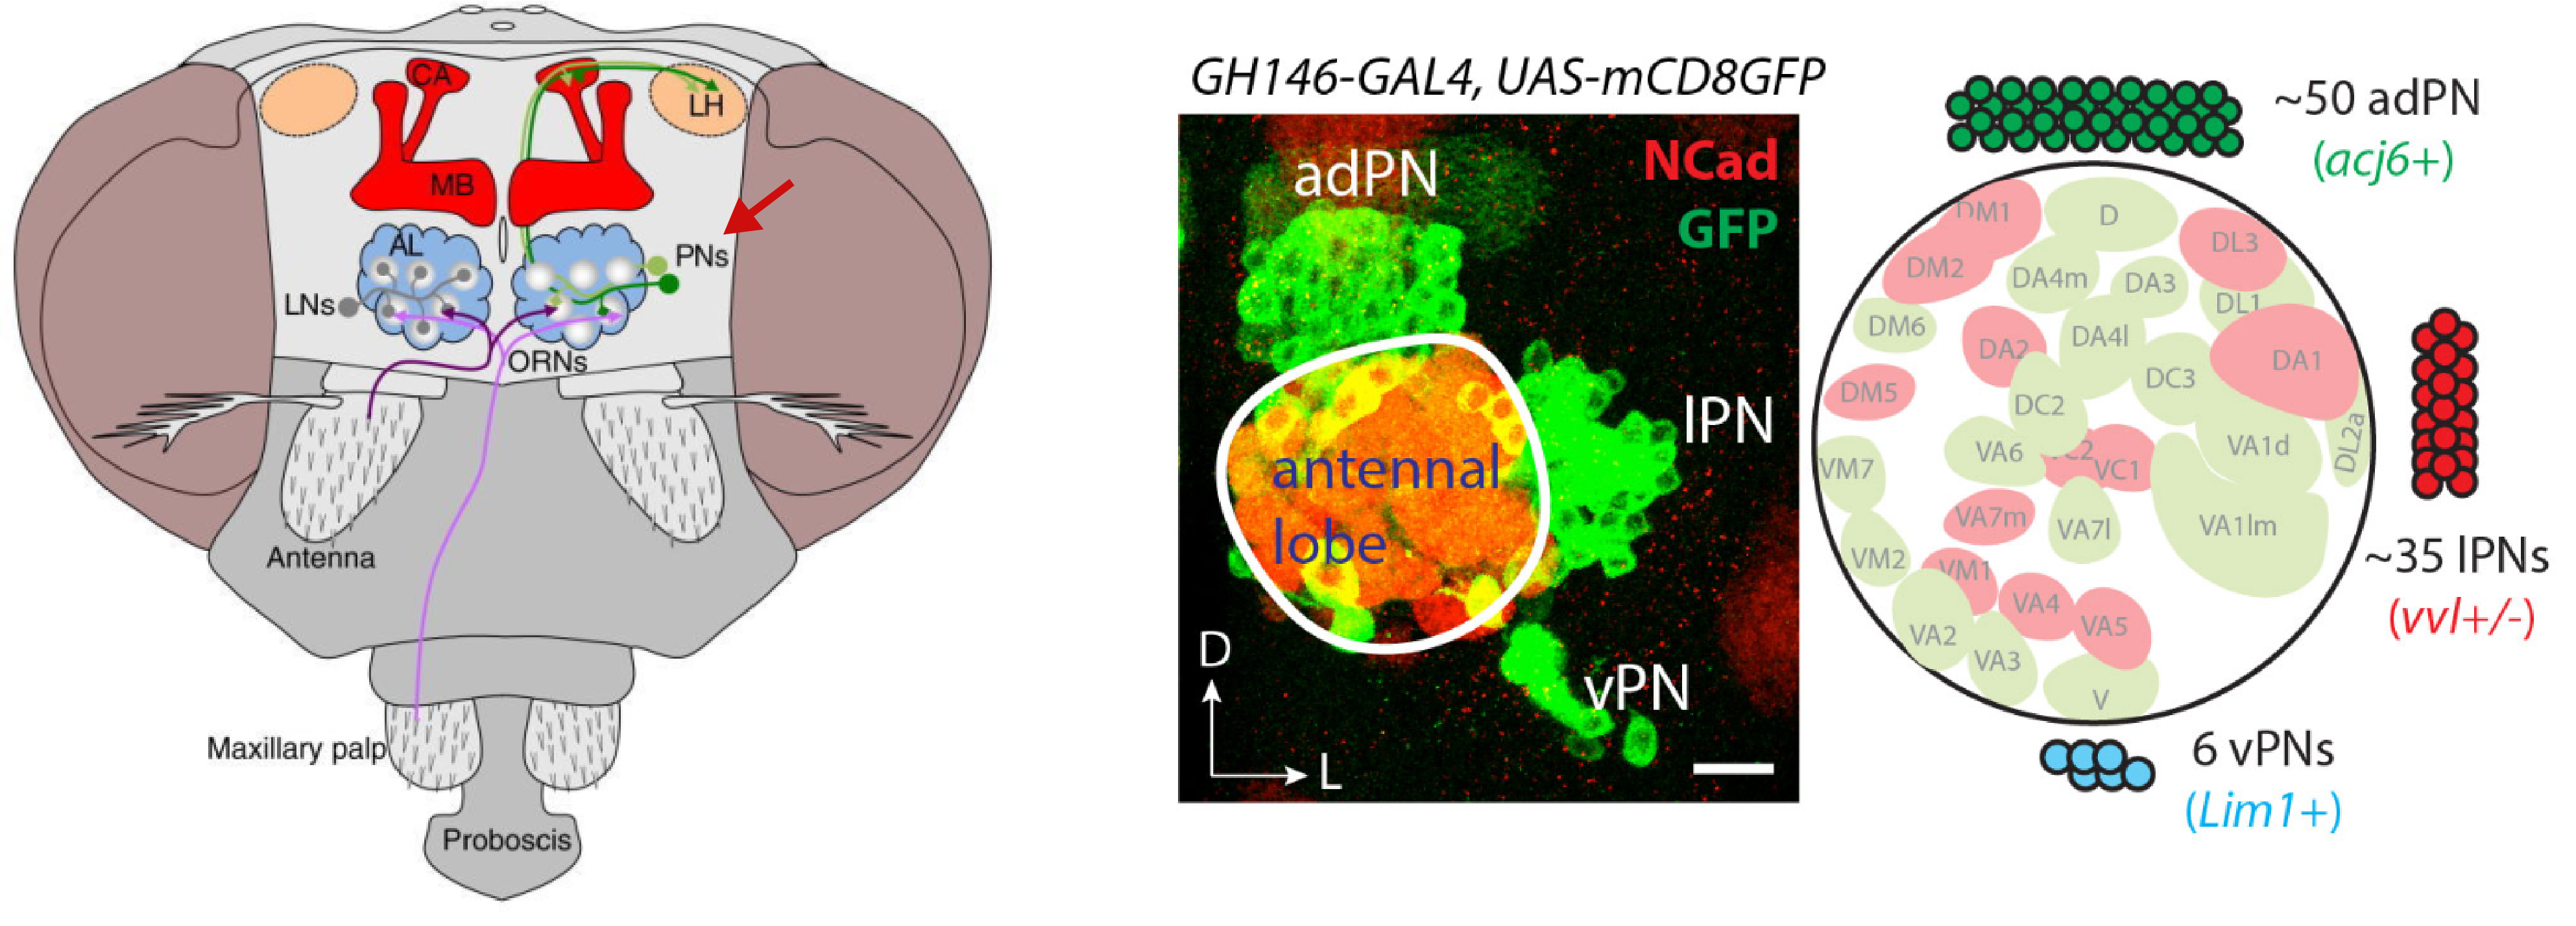
Within the olfactory projection neurons, we will try to distinguish between
the lateral anterodorsal (lPN and adPN) excitatory projection
neurons. The figure shows their anatomical position in relation to the
antennal lobe (left) and a confocal microscopy image of GH146-GAL4+ olfactory
projection neurons (Li et al., 2017).
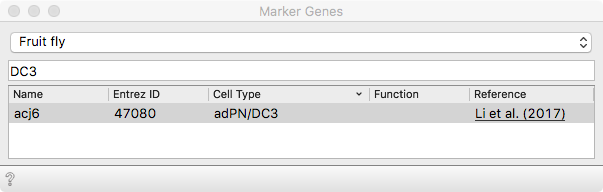
We use Marker Genes to distinguish between the IPN and adPN lineage.
Score cells will combine expression of the selected markers into an
quantitative estimate of a given cell type. It was previously shown by the same
group that the adPNs express the Abnormal chemosensory jump 6 transcription
factor (Acj6 protein).
Using Score Cells, we can assign a score to each cell that is proportional
to the expression of the acj6 gene.

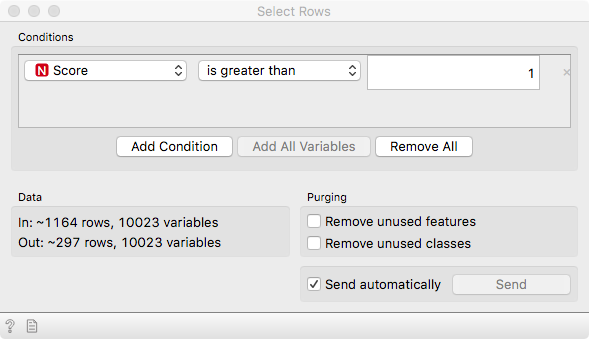
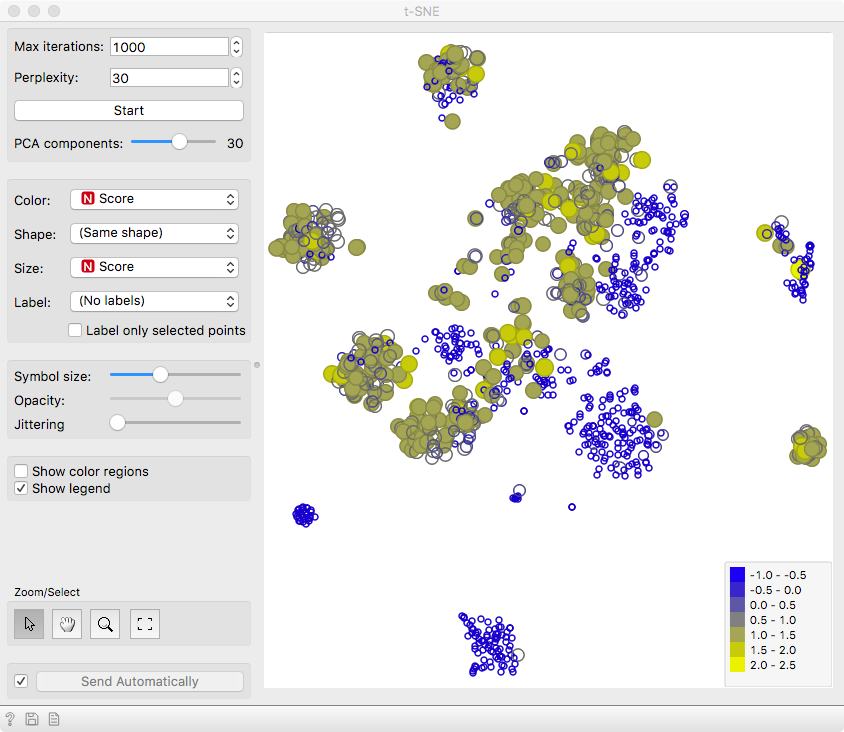
Recall that the last step of preprocessing (above) performs a z-score
(standardization) transformation for each gene. The values therefore represent
the number of standard deviations from the gene-specific mean expression. Use
Select Rows again to select cells whose marker expression (Score) is
larger that 1 standard deviation. Pass the selection to t-SNE as a Data
Subset to highlight them among all the cells.
We can see that the cells are well separated in the t-SNE
projection, confirming the utility of acj6 in distinguishing
the two neuronal subtypes.
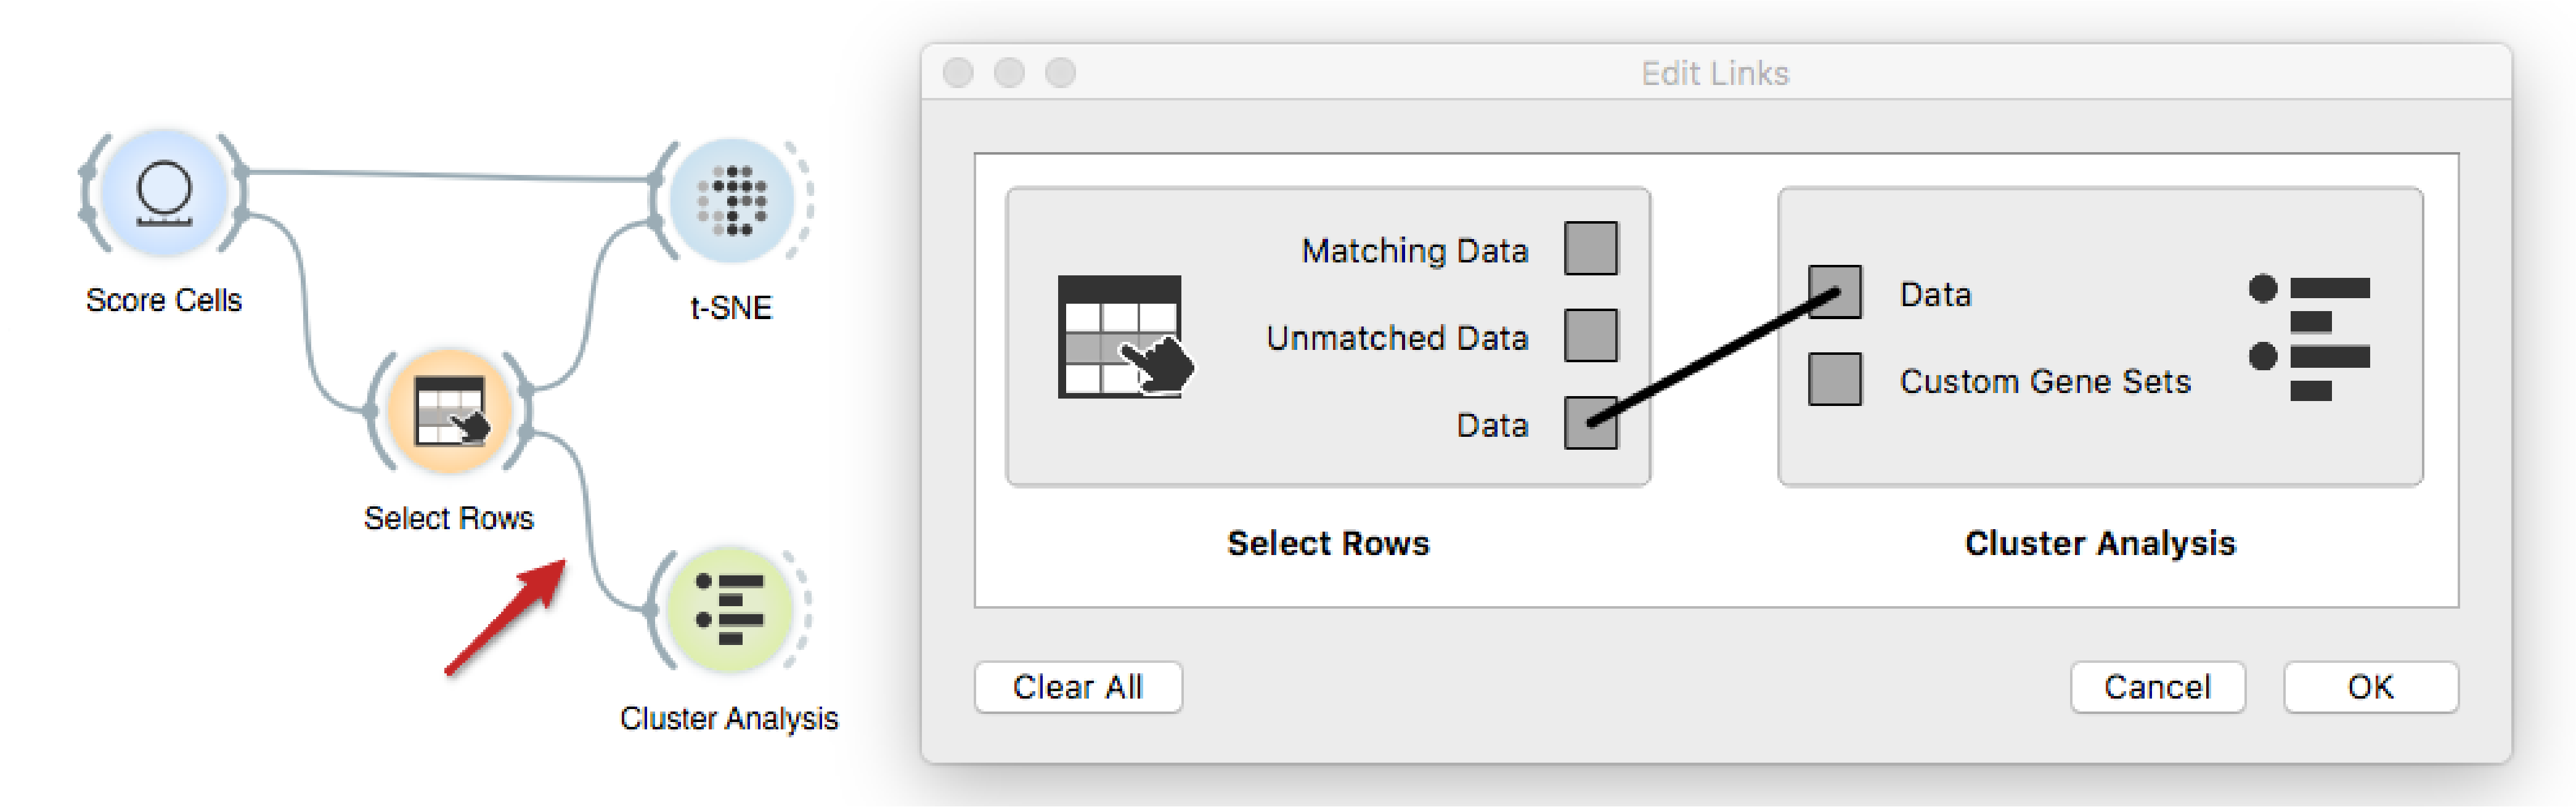
Finally, we will investigate whether there are any genes that distinguish
between two neuronal subtypes, and more interestingly, what functions are they
related to. We make sure to connect the output of Select Rows to Cluster
Analysis, such that all the data is passed onwards, but this time with a newly
created variable Selected.
By applying Cluster Analysis on the Selected variable, we can
identify the differentially expressed genes and their related functions.
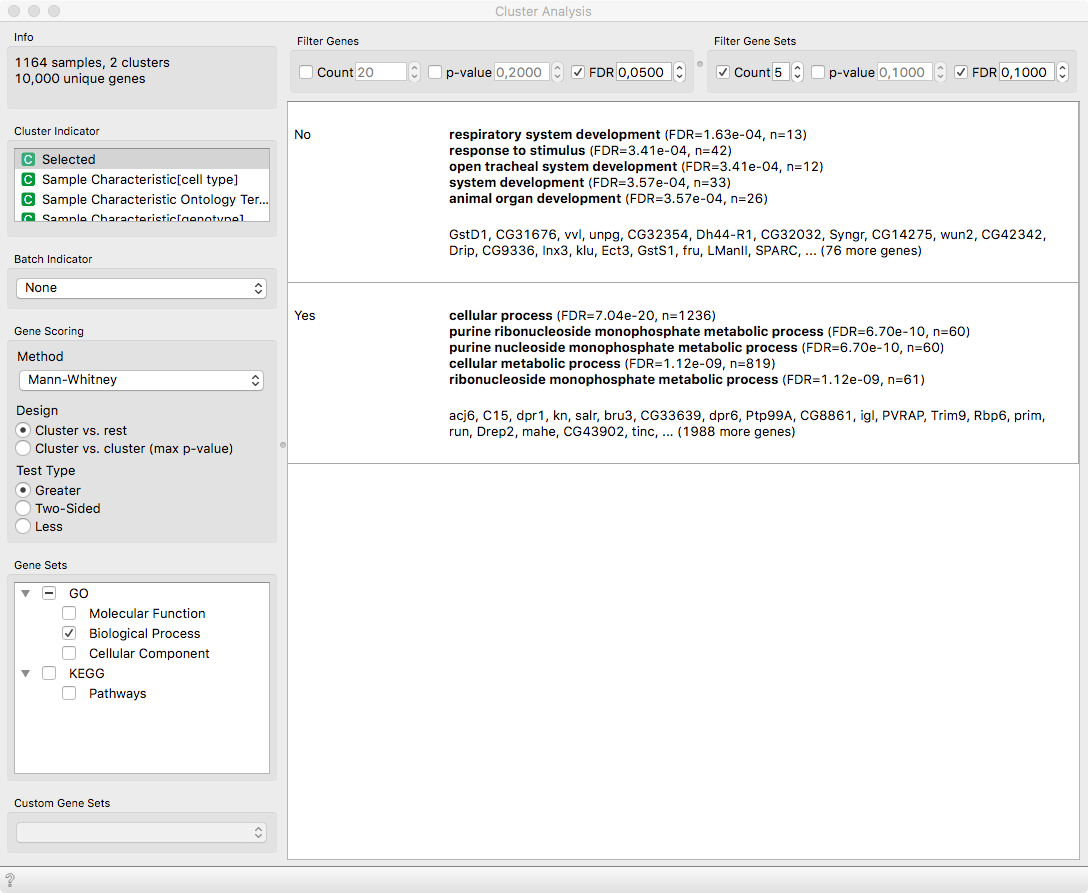
Notice that acj6 is the top differentiating gene, which should be
natural since our selection was based on it. Nevertheless, as observed by Li
et. al 2017 (see Figure 5 therein), the adPNs (Selected = Yes) play a role in
various metabolic processes, while lPNs respond to stimuli and are subject to
the development of the respiratory system.
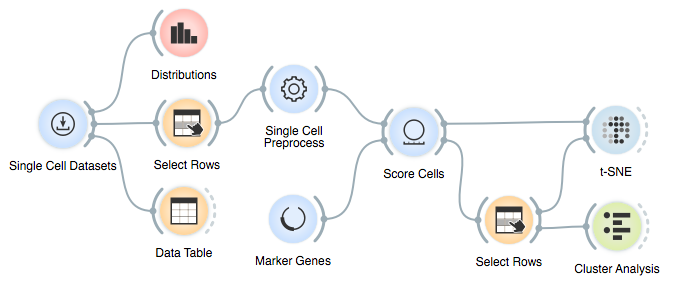
In summary, we showed how to automatically select subsets of data based on
different criteria, that can also be generated dynamically.
Here is the final workflow:
References
Li, Hongjie, et al. “Classifying Drosophila olfactory projection neuron subtypes by single-cell RNA sequencing.” Cell 171.5 (2017): 1206-1220.