Sequencing datasets often suffer from undesired technical variability, causing some cells to pick up more signal than others. The detection rate can vary considerably among genes. Ultimately, the measurements can also vary significantly when comparing data from different runs of the same experiment, taken on a different day, by a different technician, and so forth.
This calls for preprocessing and normalization methods, making the values comparable across cells, genes and experimental conditions. We will show their utility on raw count data that appears to be confounded by unwanted variation, attributed to cells being in a different cell cycle phase.
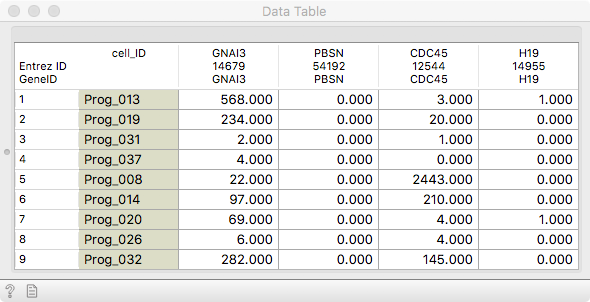
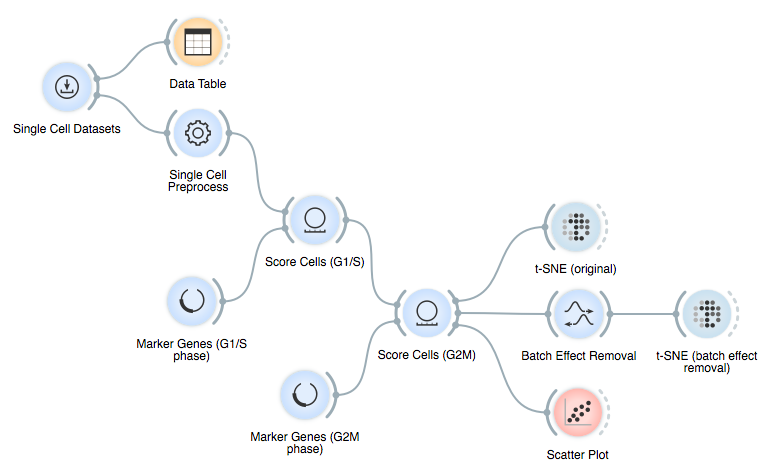
We will work with mouse haematopoietic stem and progenitor cell
differentiation data from the Single Cell Datasets. It is always good to
observe it in a Data Table.
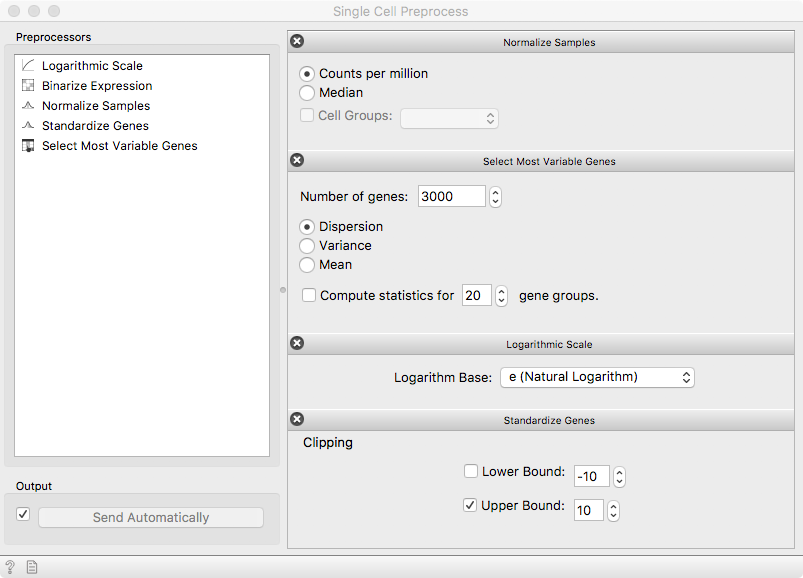
The Single-cell Preprocess widget consists of a modifiable sequence of steps to be applied on the expression data. First, we take care of different sequencing depths between the cells using the counts-per-million reads (CPM) from the Single Cell Preprocess. Then, select 3000 highly-variable genes to significantly reduce the dataset size. To account for volatile expression quantification, the data is transformed by a logarithmic transform. Finally, expression of individual genes is made comparable with standardization.
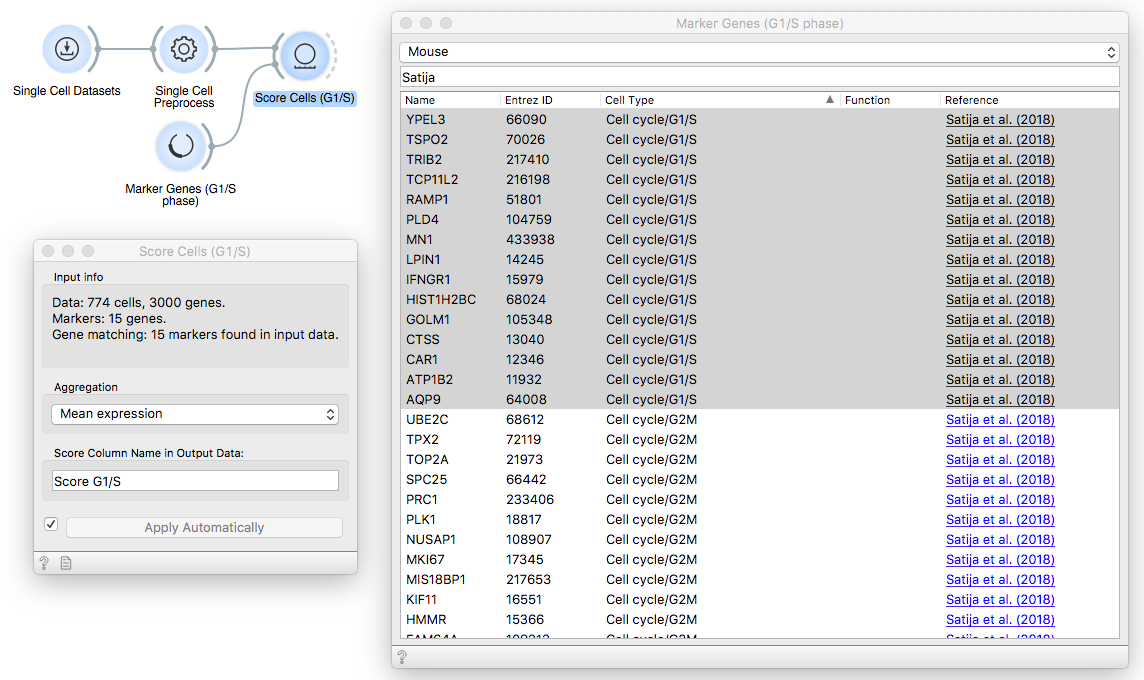
Then, pass the data through the first Score Cells widget and provide G1/S phase
markers from Satija et. al (2018) that we have loaded with Marker Genes widget.
We will repeat the same procedure with the second Score Cells and another
Marker Genes widget, this time using the G2M phase markers. Now, we have the
data with two additional meta columns containing marker gene scores, giving
a numerical estimate of the corresponding cell cycle phase.
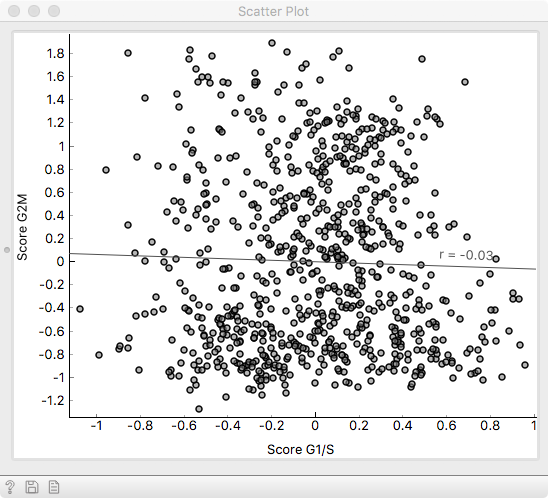
Examining the two scoring variables in a Scatter plot, we see that
they are quite decorrelated, indicating that they mark distinct subgroups of cells.
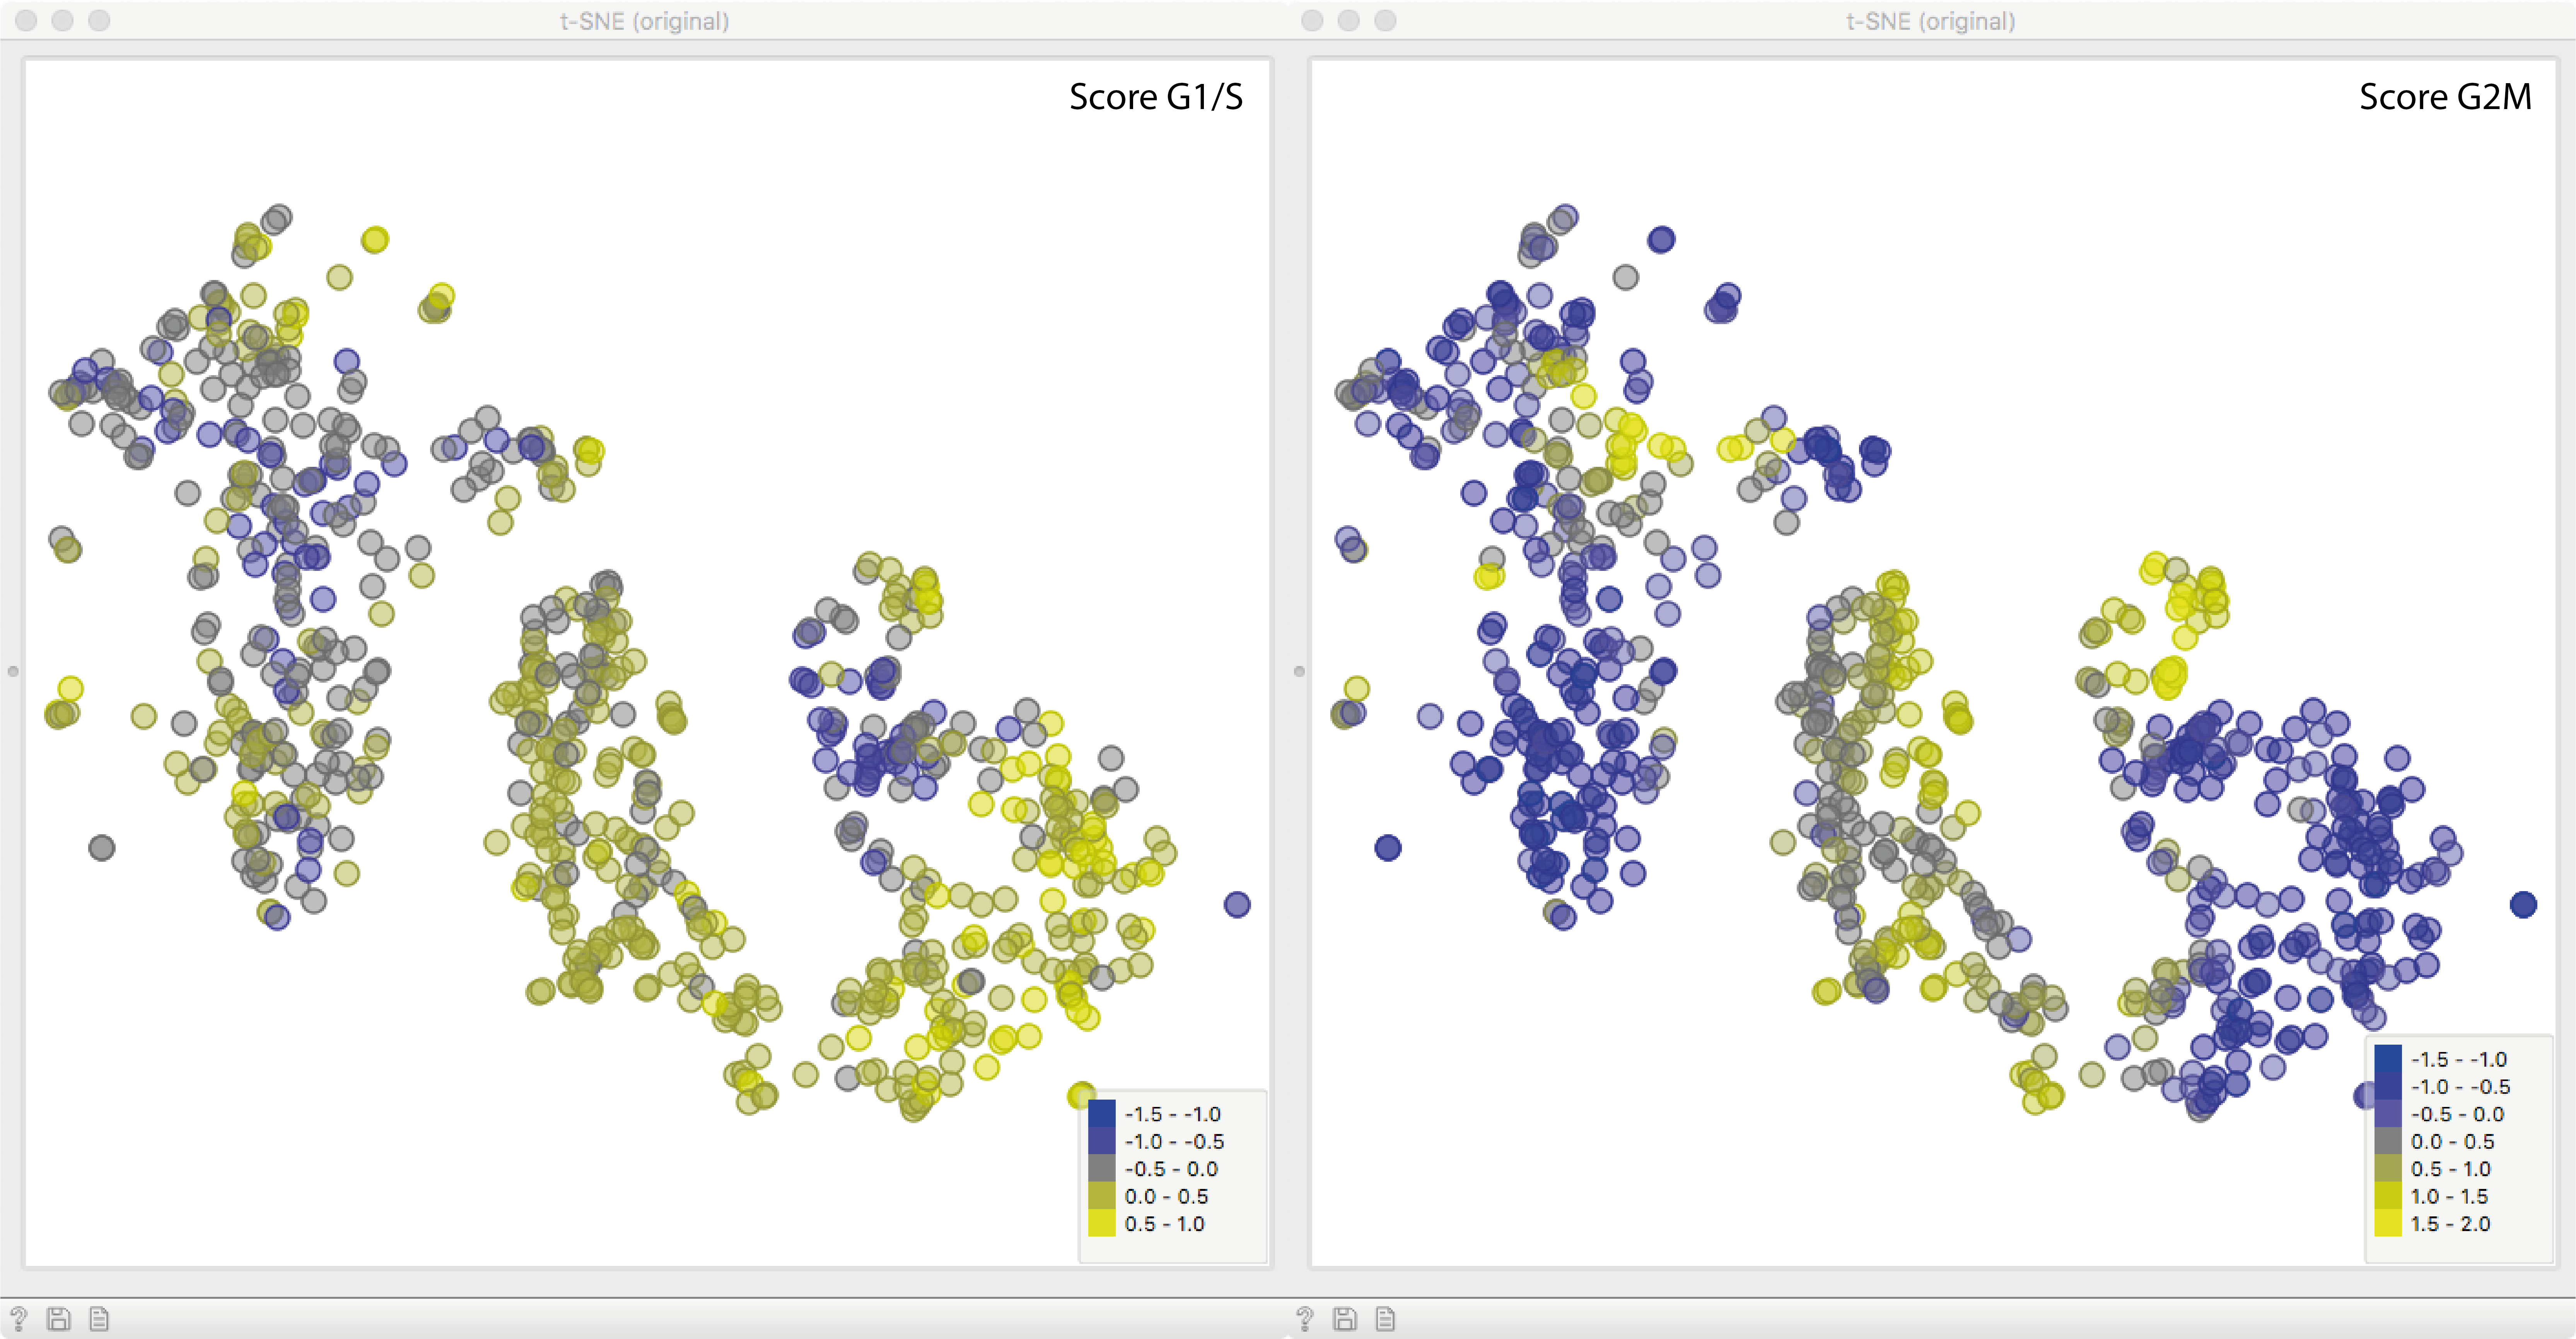
Now for the fun part. We will fire up a t-SNE plot to see what we got. Apparently,
the gene expression variance is heavily governed by cell cycle phase,
which we see by clusters of points with high scores of either cell cycle phase.
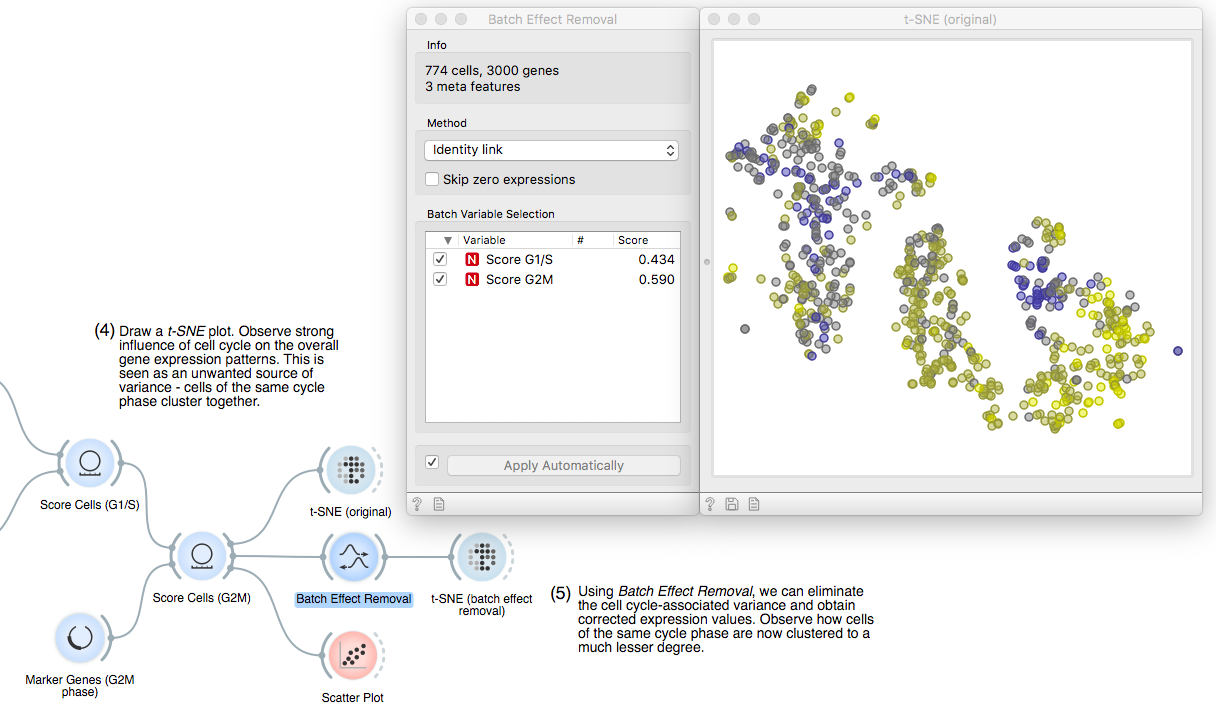
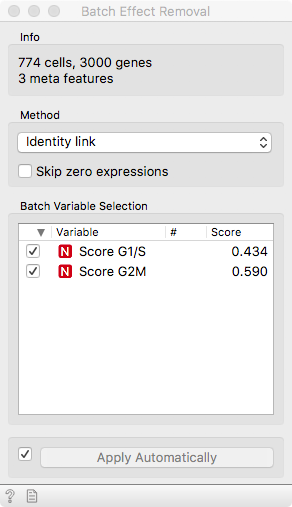
To remove this unwanted variance that would confound true cell types or
developmental stages, we make use of our good old friend linear regression. It
operates under the hood of the Batch Effect Removal widget. We can see that the
two cell cycle phase score variables are significantly correlated to 43% and
59% of the genes, respectively.
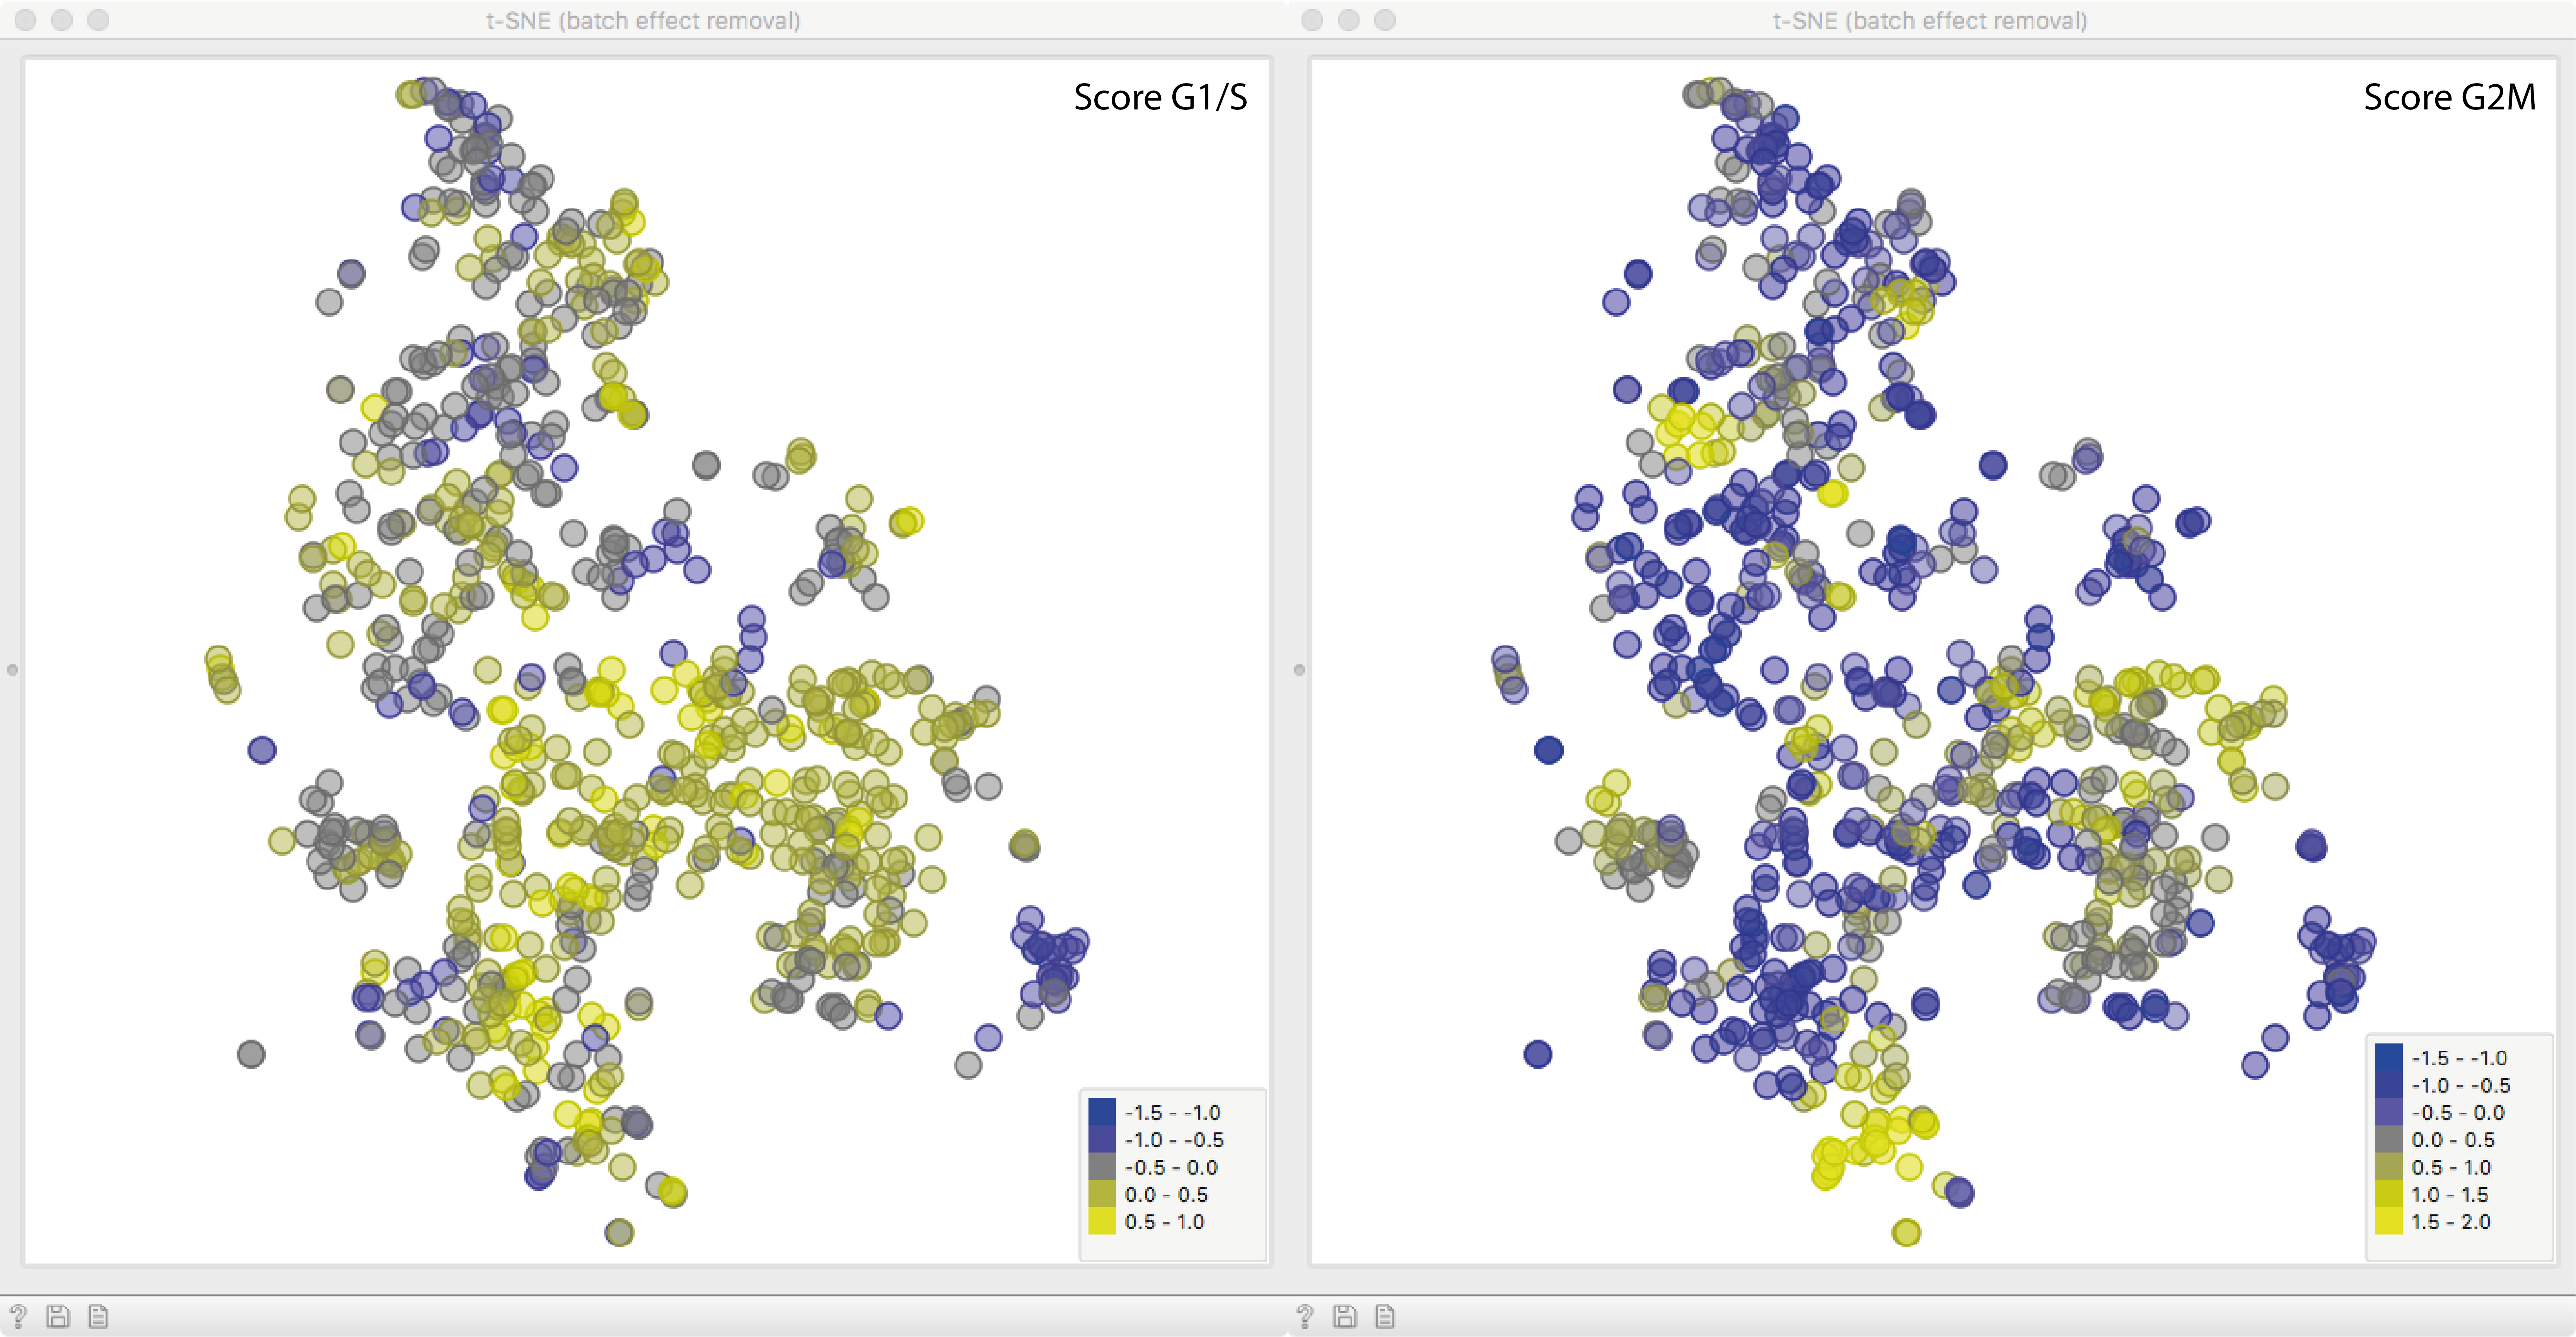
To see what we just did, let us fire up another t-SNE. The expression profiles of
all remaining genes were corrected according to the scoring variables, removing the effect of cell cycle phase almost entirely!
Here is the final workflow:
References
Satija et. al: Cell-Cycle Scoring and Regression. Vignette to the Seurat R package, 2018. http://satijalab.org/seurat/cell_cycle_vignette.html