How can we find cell populations in the absence of known markers? Automatic clustering methods and some background knowledge might help!
Louvain Clustering is a neat clustering method that detects communities in a
network of nearest neighbours. We will use this on an example of Bone marrow
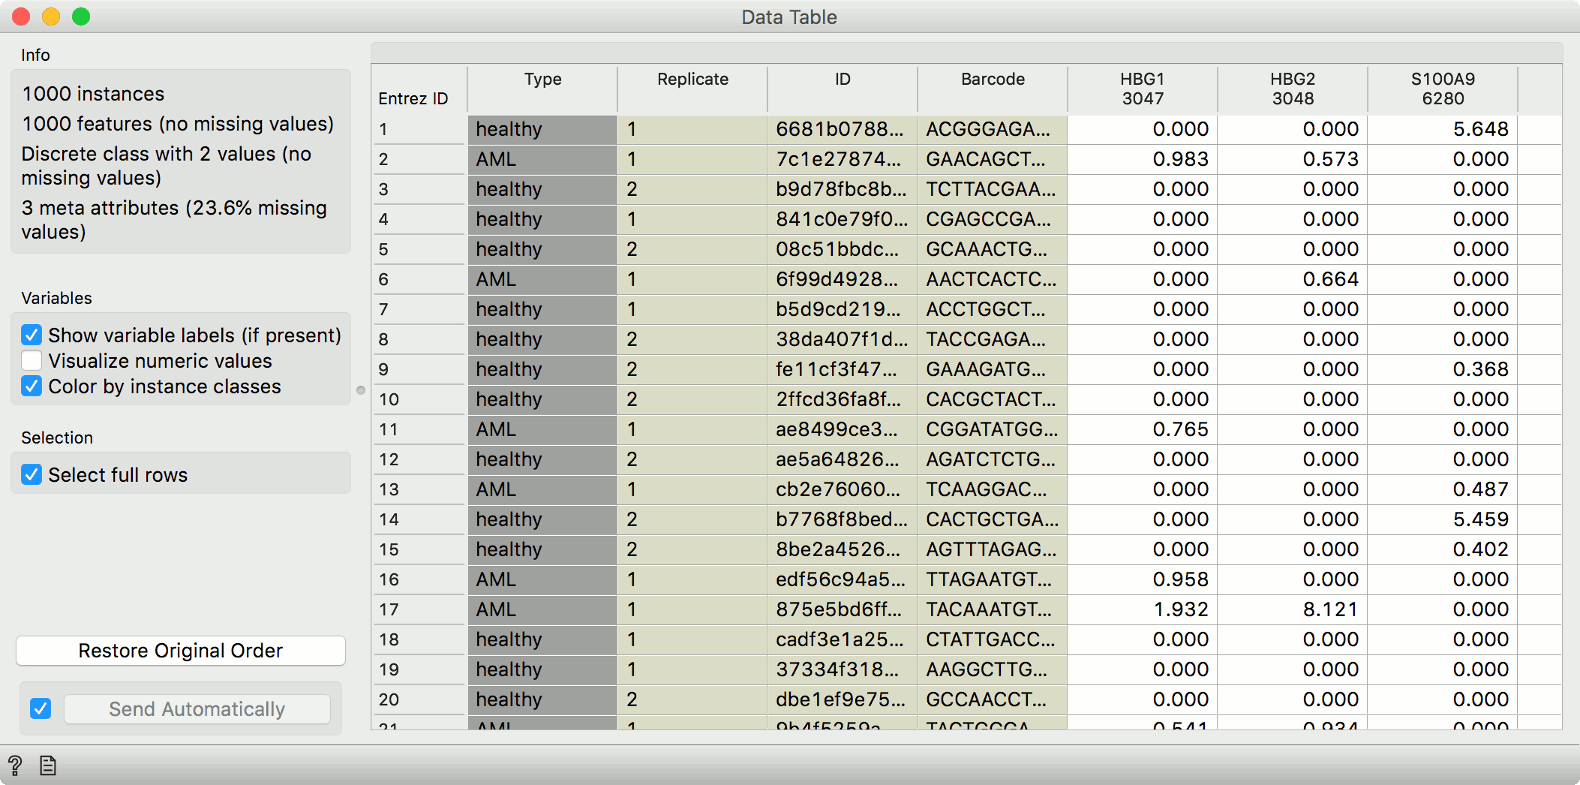
mononuclear cells with AML data (Zheng et al., 2017), that we have retrieved
with the Single Cell Datasets widget. First, let us observe the data in a Data
Table.
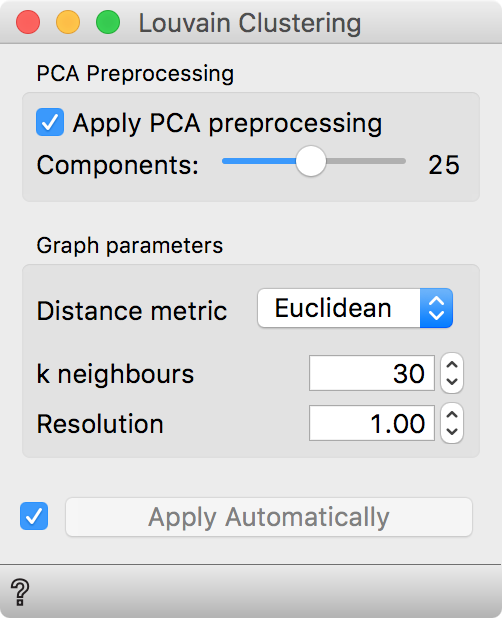
Now, let us pass the data through Louvain Clustering. We use 25 principal
components for better efficiency and the euclidean distance to determine
similarities between each pair of cells. Louvain Clustering will append an
additional column with information of cluster label of each cell.
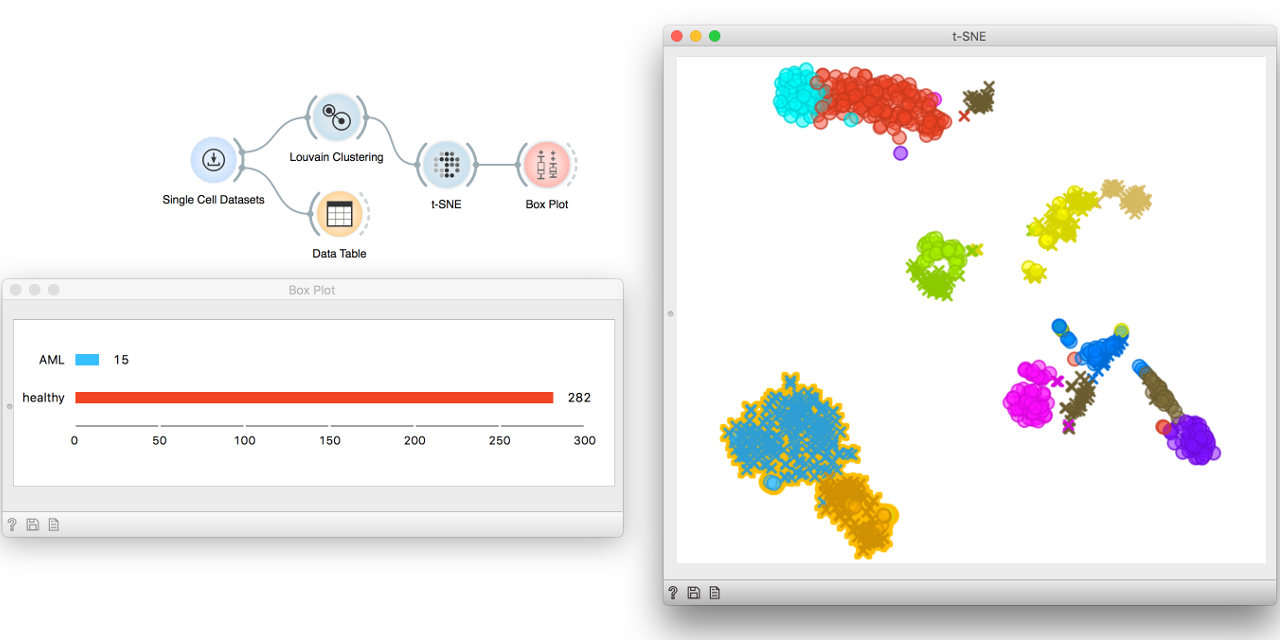
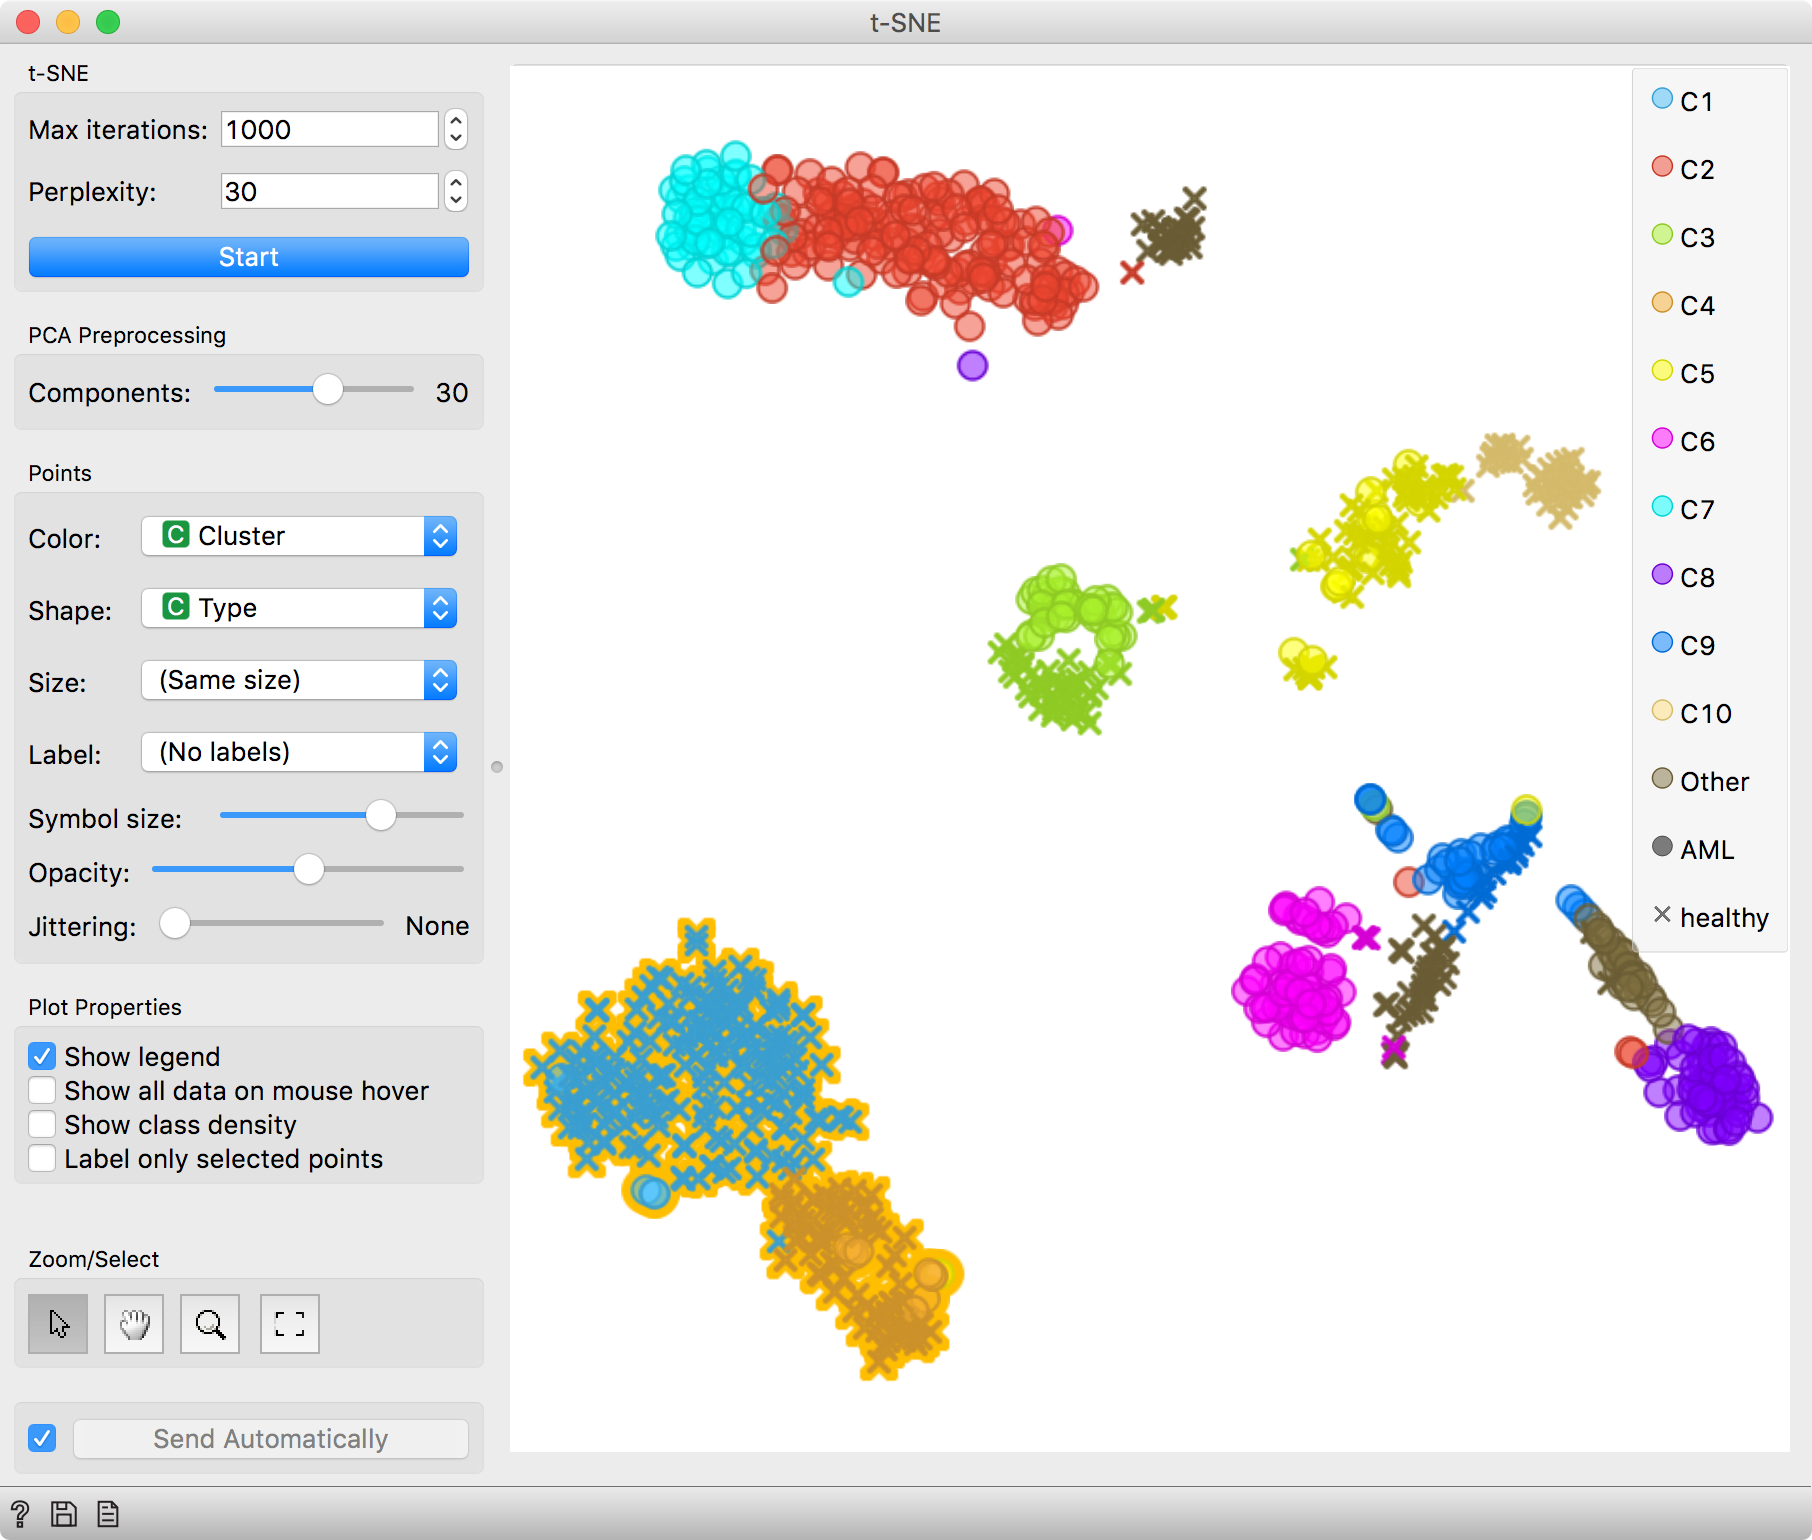
We can observe the results of clustering in a cell landscape, that we plot with
the t-SNE widget. Coloring cells by cluster label comes in handy here. Cells
get nicely clustered with t-SNE and the clusters also correspond with the
Louvain clustering. Great!
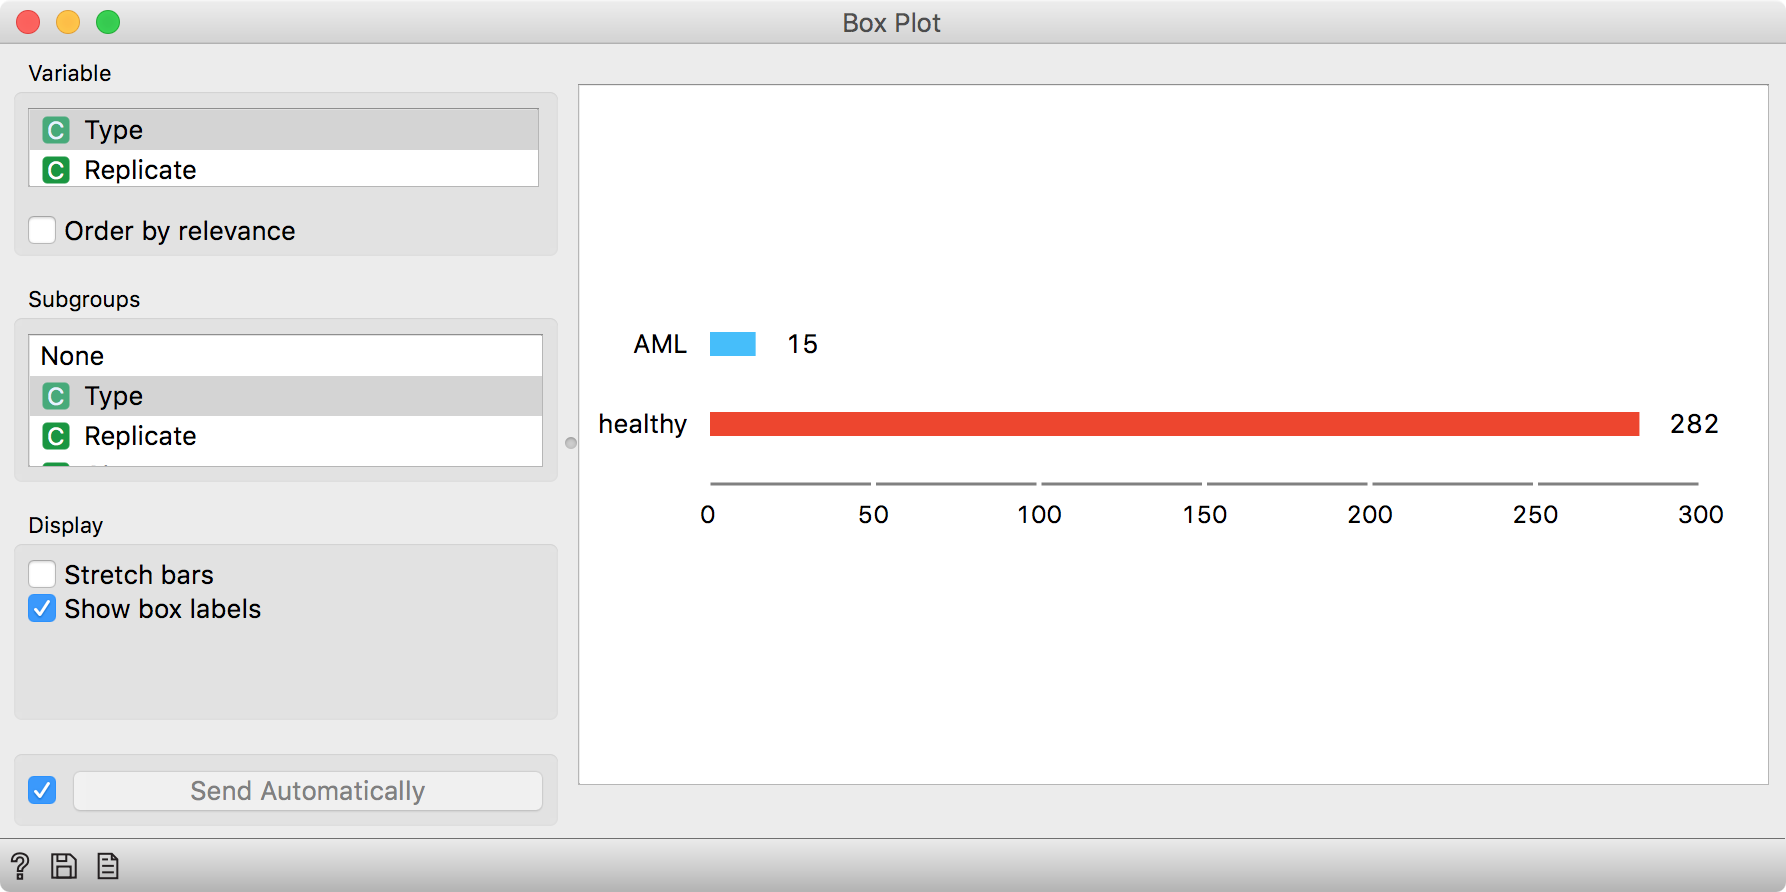
What is in our newly found clusters? We can observe the distribution of cell
types in a Box Plot. Let us select a group of cells from the t-SNE plot and
send it to Box Plot. The group we have selected contains mostly healthy cells.
This means cells from healthy patients have generally a distinct expression
profile.
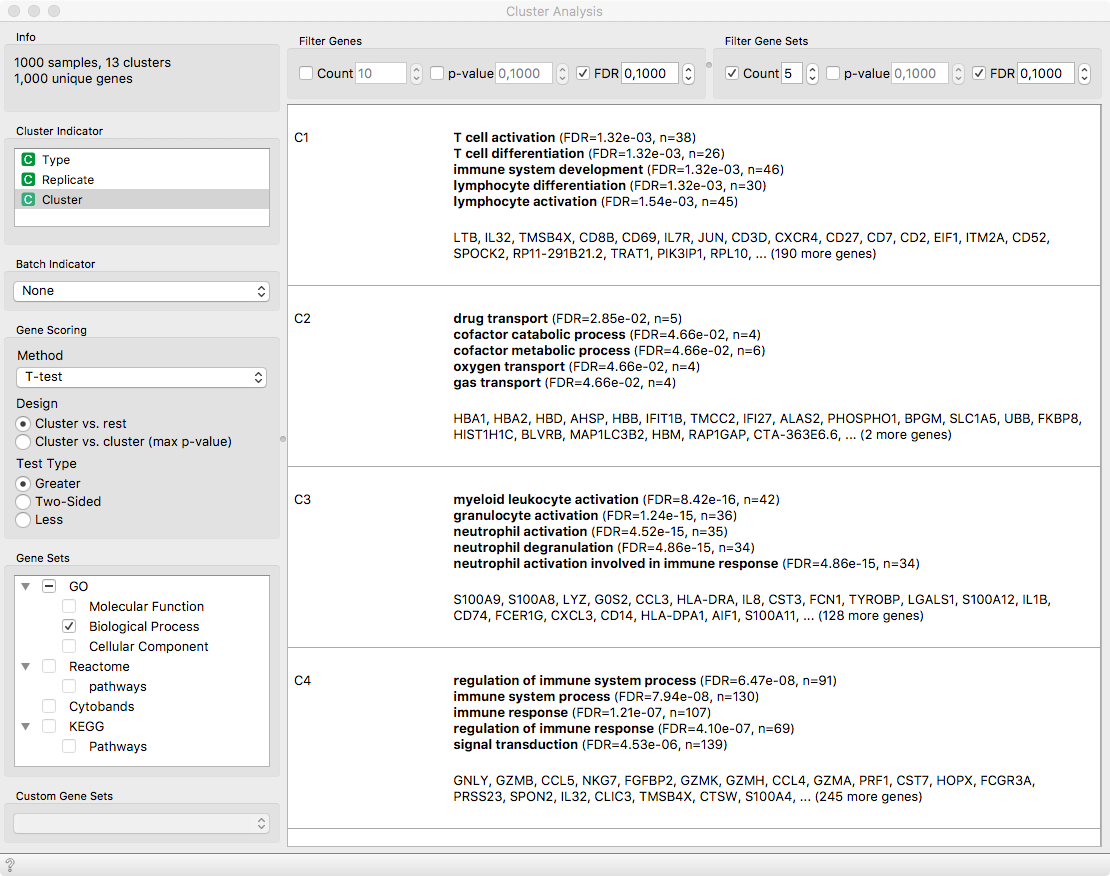
In our previous post, we used background knowledge in form of cell type markers to determine cell types. Here, we go a step further. First, we will use a statistical test seek genes that are differentially expressed in each cluster. Then, we will analyze each list of cluster-specific genes against the Gene Ontology term database, that associates genes with their biological processes, molecular functions and cellular localizations. These information will hint at possible subpopulations in clusters!
The clusters indeed contain something; C1 appears to be a cluster of T-cells,
C2 appears to be related to red blood cells responsible for oxygen transport,
C3 is another cluster of white blood cells. Cells in C4 regulate immune
response and are most likely Natural Killer cells, which is exacerbated by
their characteristic genes GNLY, NKG7 and others.
Cluster Analysis reveals cluster-specific genes and their associated functions.
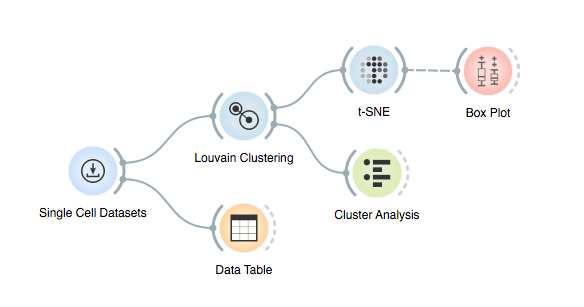
Here is the final workflow that enabled us to find meaningful groups in our data without having to specify population markers directly!
References
Zheng, Grace XY, et al. “Massively parallel digital transcriptional profiling of single cells.” Nature communications 8 (2017): 14049.