The Nobel prize in medicine 2018 was awarded for the discovery of cancer therapy by inhibition of negative immune regulation. Since then the attempts to improve the results of the checkpoint blockade immunotherapy have highlighted the importance of understanding the heterogeneity of the cells. Here we will show how scOrange can be used in this expanding field of research by reproducing a part of the study by Miller et al. published in Nature Immunology this March.
Namely, we will be comparing single cell expression profiles of T cells isolated from tumours (TIL) and from T cells during chronic viral infection with lymphocytic choriomeningitis virus (LCMV), to see whether the states of dysfunctional CD8+ TILs are comparable to those of T cell exhaustion in LCMVs.
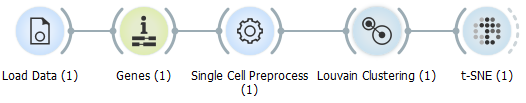
Naturally, we first need to download data which was deposited on the GEO database by Miller et al. in two supersets: GSE122675 - TIL superset and GSE122712 - LCMV superset. Alternatively, you can avoid having to download data from the GEO database by using the Single Cell Datasets widget to load the Tumor infiltrating CD8+ and the CD8+ in chronic viral infection datasets.
Make sure you download files in MTX format, each superset into a separate folder, and rename files into matrix.mtx, genes.tvs and barcodes.tvs, since this is the format automatically recognised by the Load Data widget in scOrange.
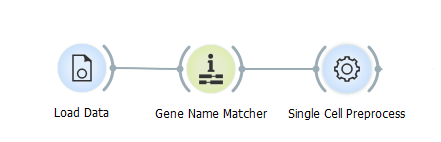
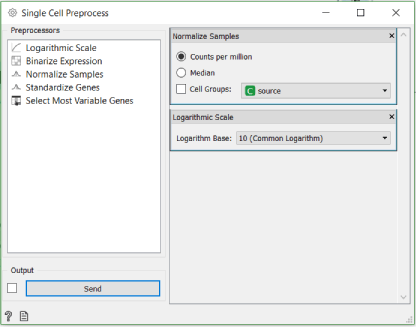
So, now we have both datasets and before we start clustering them, we have to name genes and normalise the data using Genes and Single Cell Preprocess widgets.
After that we start by clustering the LCMV superset and later, using the marker genes, we identify here, for stem-like and terminally exhausted CD8+ T cells, to see if we can classify the same groups in TIL superset.
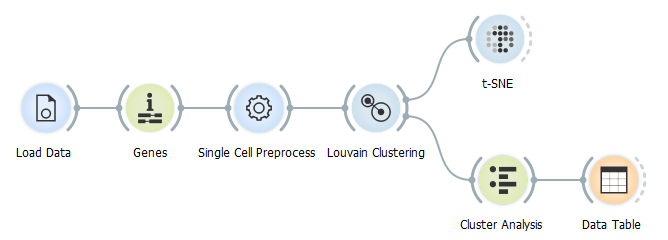
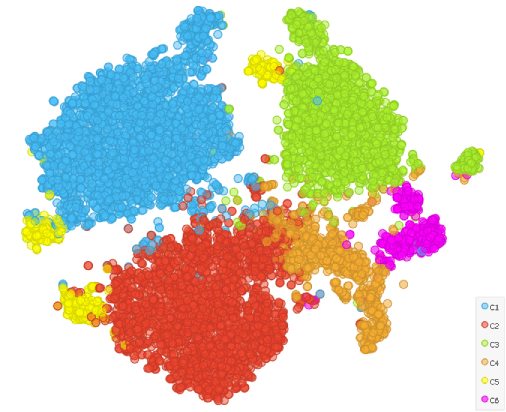
We drive the data through the Louvain Clustering widget, where we set the resolution to 2.3 and k neighbours to 100 to elicit 6 clusters.
In order to identify our clusters and their marker genes, we run the Cluster Analysis widget using the Mann-Whitney method since our data is not normally distributed. We set the gene count to 200 to determine a higher number of the significant genes.
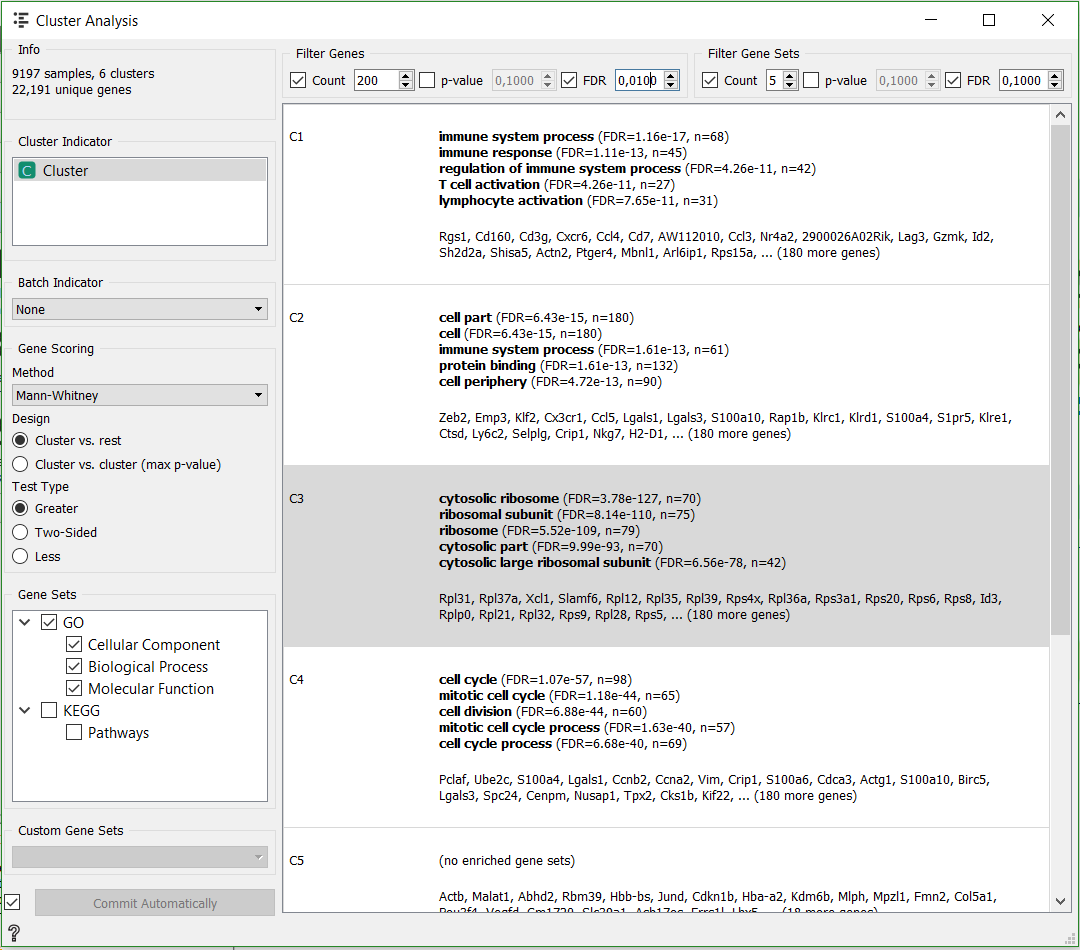
Data Table widget helps us in displaying marker genes for selected clusters and ordering them by their statistic score.
Accordingly, C1 cluster is identified as containing terminally exhausted T cells (Cd7, Cd160, Rgs1), C2 as effector cells (Cd7, Cd160, Rgs1), C3 are progenitor exhausted T cells (Tcf 7, Xcl) and C4 proliferating cells (Cdc6, Bub1). Given the size and the genes that define the remaining two clusters, we can assume they are representative of contaminating naive T cells.
t-SNE projection is created with the t-SNE widget.
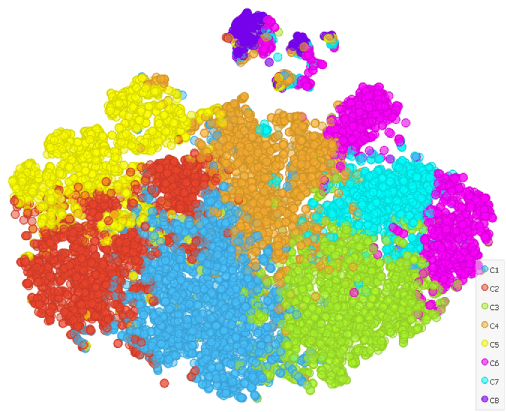
We use the same workflow to attain t-SNE projection for the TIL subset, but this time we set the resolution to 1.4 in the Louvain Clustering widget to elicit 8 clusters.
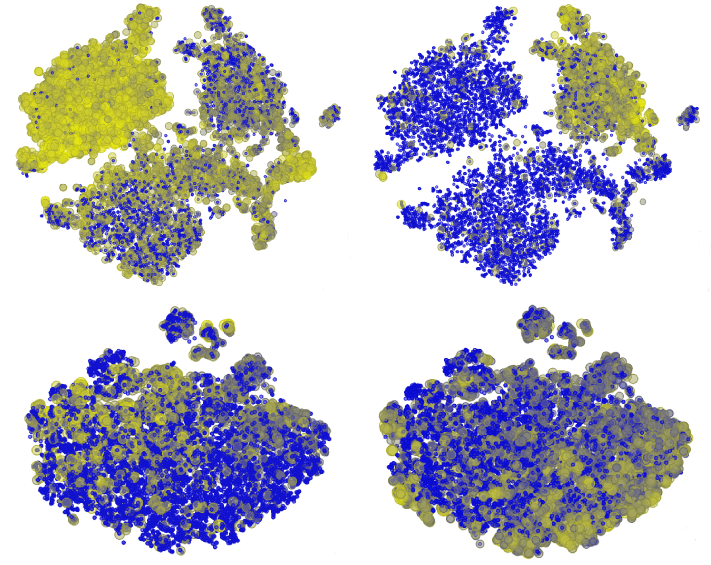
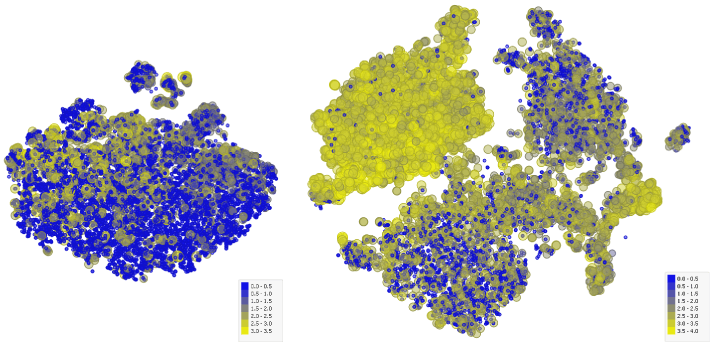
To test if LCMVs and TILs elicit analogous subsets of exhausted T cells, we use the marker genes, we identified for both subgroups in previous steps, to colour and size cells in t-SNE projections.
One of the marker genes for terminally exhausted T-cell we have identified is Cd7. The same gene was singled out by Miller et al. as well. So, let’s take a look at how it applies on TIL (left) and LCMV (right) datasets. In both projections the cells associated with the selected gene seem to be predominantly located in specific clusters.
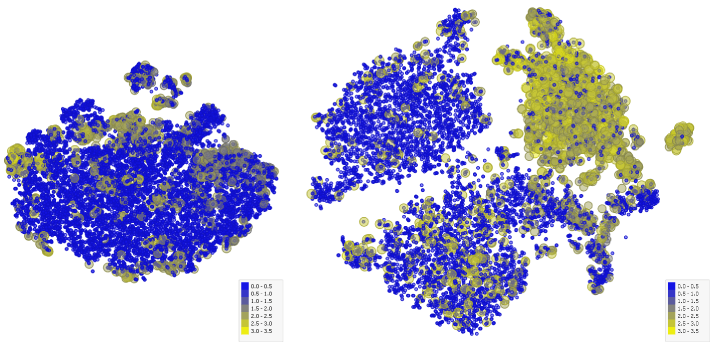
Similarly we both identified Tcf7 as the marker gene for progenitor exhausted T cells. Tcf7 is more expressed in different clusters of T cells isolated from mouses chronically infected with LCMB than the marker gene Cd7, but the arrangement of its expression in T cells isolated from tumours is not noticeably divergent.
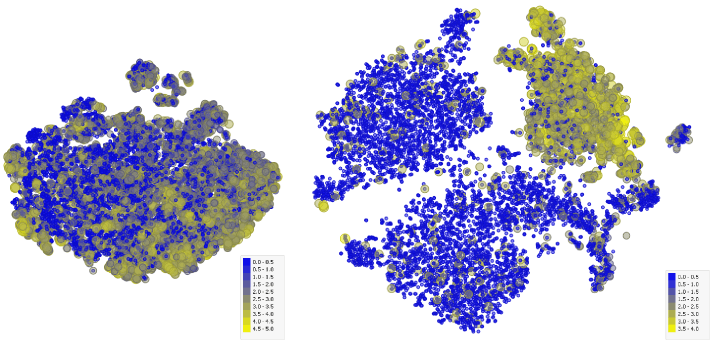
Because of that we decided to seek out another marker gene for progenitor exhausted T cells which is predominantly significant in different clusters in TIL and LCMV subsets. One of the highest scoring genes for C3 cluster in LCMV superset is Xcl1 and tSNE projections reveal much better distinguishment in TIL subset as Tcf7.
We have demonstrated that scOrange is applicable to the single cell data from studies in the field of immunotherapy. The marker genes singled out here could help identify and better target progenitor exhausted T cells to reinvigorate their response to tumour cells with anti-PD-1 therapy.
References
Miller CM, Sen DR, Abosy RA et al. (2019) Subsets of Exhausted CD8+ T Cells Differentially Mediate Tumor Control and Respond to Checkpoint Blockade. Nat Immunol. 20:326–336.